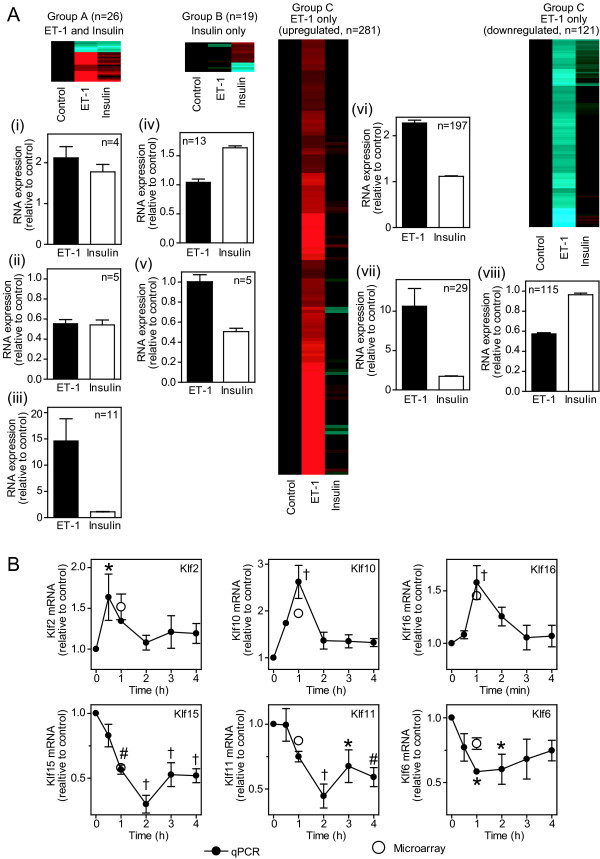
Figure 2.
Effects of ET-1 and insulin on the global cardiomyocyte transcriptome. A, Cardiomyocytes were exposed to 100 nM ET-1 or 50 mU/ml insulin (1 h) or left unstimulated (Control). Total RNA was extracted and the global transcriptome analysed using microarrays. Transcripts with significant changes in expression (FDR < 0.05, >1.5-fold change) induced by either ET-1 or insulin relative to controls were clustered according to responsiveness to both agonists [Group A: (i) similar upregulation with both, (ii) similar downregulation with both, (iii) greater response to ET-1 than insulin], responsiveness to insulin alone [Group B: (iv) upregulated by insulin, (v) downregulated by insulin] or responsiveness to ET-1 alone [Group C: (vi) and (vii) upregulated by ET-1, (viii) downregulated by ET-1. Heatmaps represent the mean values of all probesets in each group with normalisation per gene to control values [Log2 scale; -2.0 (cyan) through 0 (black) to 2.0 (red)]. Histograms are means ± SEM for the RNAs in each group (numbers of transcripts in parentheses). B, Cardiomyocytes were exposed to insulin for the times indicated and mRNA expression of Klf2, Klf6, Klf10, Klf11, Klf15 and Klf16 measured by qPCR. Data were normalised to Gapdh. Solid circles represent qPCR data. Results are means ± SEM (n = 3 independent preparations of cardiomyocytes). * p < 0.05, # p < 0.01, † p < 0.001 relative to controls (one-way ANOVA with Tukey post-test). For comparison, microarray data are shown as open circles (means ± SEM, n = 4).

