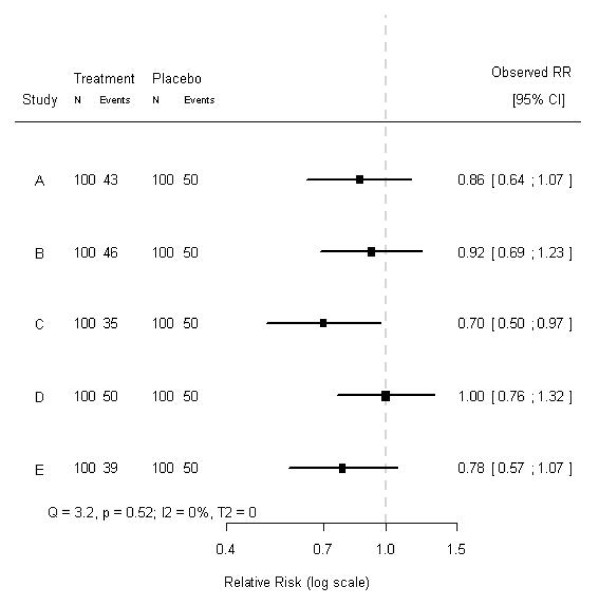
Figure 1.
Forest plot of a hypothetical meta-analysis of five studies. The treatment effects and corresponding 95% confidence intervals of five studies included in a hypothetical meta-analysis are shown. The dashed line (- - - -) indicates no treatment effect. The studies are ordered chronologically.

