
Figure 1. Single neuron dynamics.

A, single-neuron state transitions, with the transition rates marked; for the  th neuron, the total synaptic input is the sum of network input and external input,
 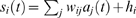 . B, graph of the response function
  for
for  .
.
Official websites use .gov
A
.gov website belongs to an official
government organization in the United States.
Secure .gov websites use HTTPS
A lock (
) or https:// means you've safely
connected to the .gov website. Share sensitive
information only on official, secure websites.
A, single-neuron state transitions, with the transition rates marked; for the th neuron, the total synaptic input is the sum of network input and external input, . B, graph of the response function for .