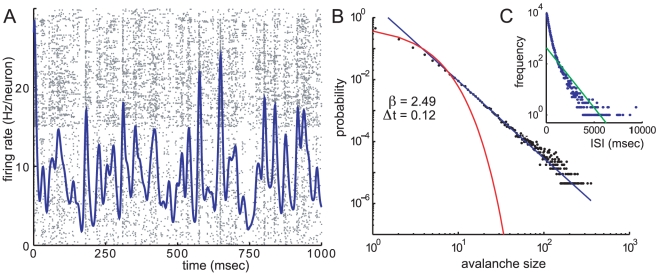
Figure 7. Avalanches in a sparsely connected network.
Results from an excitatory and inhibitory network with  , with 17% connectivity. See text for details of sparse weight matrix. A: Raster plot and mean firing rate. B: Avalanche size distribution, calculated with bin size
  and showing poisson fit (red) and power law fit (blue) with exponent
  . C: Inter-spike-interval distribution with exponential fit (green).

