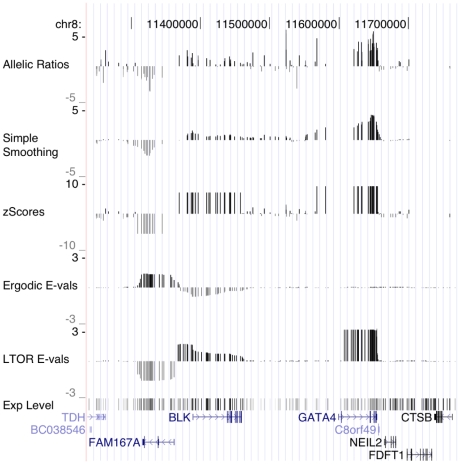
Figure 3. Raw data and predictions.
Example of genomic region with allelic imbalance. From top to bottom: Raw allelic log-ratio; Simple smoothing predictions; Z-score predictions; Ergodic 8-state predictions (expected allele log-ratio); Left-to-right 8-state HMM predictions (expected allele log-ratio); Raw total expression; UCSC known genes track. Data shown is for HapMap individual NA11840. Note: Allelic ratios at homozygous sites are not shown.

