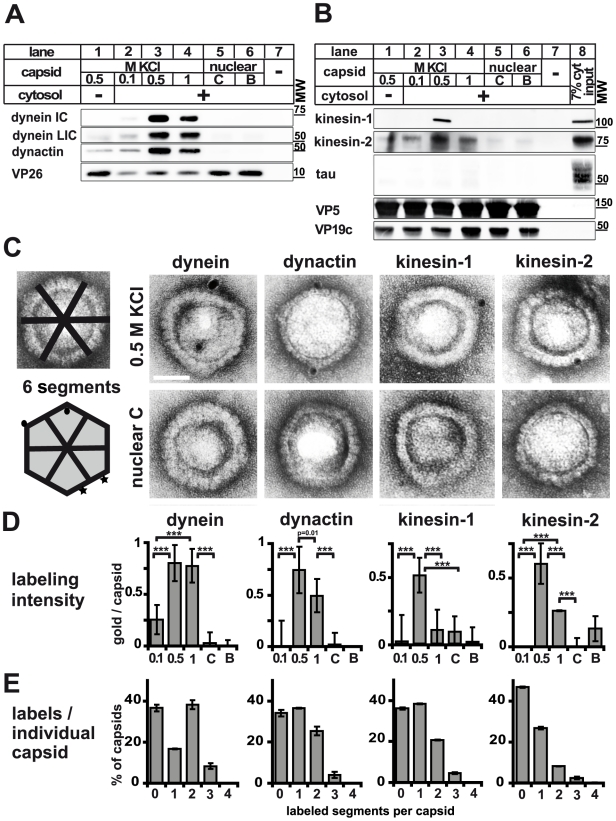
Figure 2. Plus- and minus-end directed MT motors bind to HSV1 capsids.
A and B: Immunoblot analysis of MAP binding to capsids. HSV1(F) viral (0.5 M KCl, lanes 1 and 3; 0.1 M KCl, lanes 2; 1 M KCl, lanes 4) or nuclear capsids (C capsids, lanes 5; B capsids, lanes 6) or mock samples lacking capsids (lanes 7) were incubated in 0.25 mg/ml (A, lanes 2 to 7) or 0.75 (B; lanes 2 to 7) mg/ml pig brain cytosol, and sedimented through sucrose cushions. The host proteins were analyzed by immunoblot using antibodies against dynein (A: MAB1618 against intermediate chain; pAb anti-LIC2 against light intermediate chain), and dynactin (A: mAb anti-p50), or kinesin-1 (B: MAB1613 against heavy chain), kinesin-2 (B: mAb against KAP3A) and tau (B: pAb). The amount of capsids in each sample was estimated by labeling the major capsid proteins VP26 (A: pAb anti-VP26), VP5 (B: pAb NC-1), or VP19c (B: pAb NC-2). As a loading control, 7% of the amount of the input cytosol was also directly analyzed (B; lane 8). C: Immunoelectron microscopy images of HSV1(F) capsids incubated with 0.75 mg/ml pig brain cytosol and labeled with mouse monoclonal antibodies against dynein (MAB1618 against intermediate chain), dynactin (mAb anti-p50), kinesin-1 (MAB1613 against heavy chain) or kinesin-2 (mAb K2.4 against KIF3A) followed by rabbit-anti-mouse antibodies, protein-A gold and negative staining. Scale bar: 50 nm. D: Quantification of the labeling intensity of different capsid types. After immunogold-labeling with antibodies against MAPs, negative staining and electron microscopy, the number of gold particles per capsid was counted for 100 to 170 capsids. Labeling of capsids incubated with buffer instead of cytosol was considered background and subtracted. Error bars: SEM. Three asterisks denote P<0.0001 as determined in a two-sided Student's t-test. E: Labeling frequency for different MAPs on individual viral capsid treated with 0.5 M KCl. In a two-dimensional projection, the icosahedral capsid appears as a hexagon that can be divided into 6 segments (c.f. C; schematic capsid). The number of capsids that had labeling on 0, 1, 2, or more of such segments was counted. Gold particles were counted as multiple labeling events when they were more than 40 nm apart (C; circles on schematic capsid). Labels in closer proximity were scored as only one label (C; stars on schematic capsid). Error bars: SEM. The quantifications (D, E) were compiled from three experiments analyzing dynein, dynactin and kinesin-1 and two experiments for kinesin-2.

