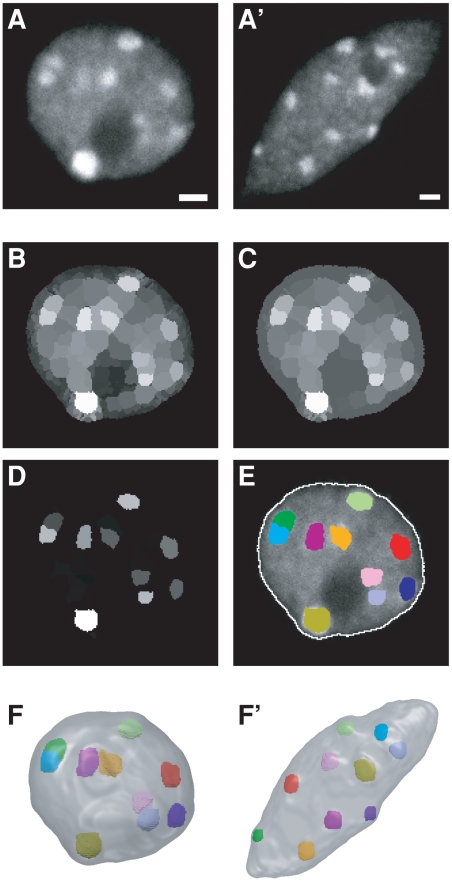
Figure 2. Image processing and 3D modeling of Arabidopsis nuclei.
(AA′) Single confocal microscopy section through a rounded (A) and elongated (A′) nucleus. (B–E) Segmentation of the nuclear envelope and chromocenters. Following an initial partition of the 3D image using the watershed transform (B), a closing morphological operation was applied to the region adjacency graph (C) and each region was assigned a shape/contrast index (D). The chromocenters obtained by applying a threshold to the index map are shown in (E) as colored regions superimposed over the corresponding single section image. The nuclear boundary (white contour) was obtained by applying a threshold to the original 3D image. Note that chromocenters are distributed within the whole nucleus, and not confined to the nuclear periphery. (FF′) Resulting 3D models for the rounded (F) and elongated (F′) nuclei. Scale bar: 1 µm.

