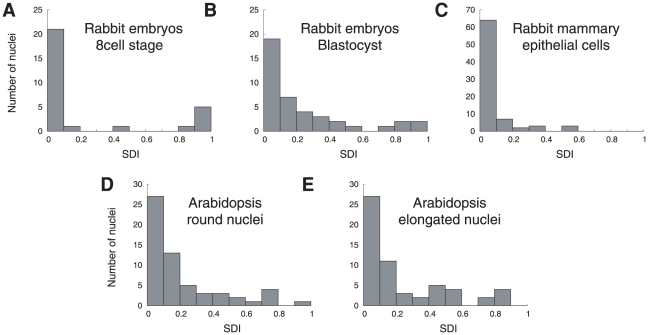
Figure 6. Histograms of the F-function-related spatial distribution index, within the five cellular types.
For each nucleus, the SDI is the probability of observing, under a completely random binomial point pattern, a difference at least as large as that observed between the empirical and the CRBPP mean F-functions.

