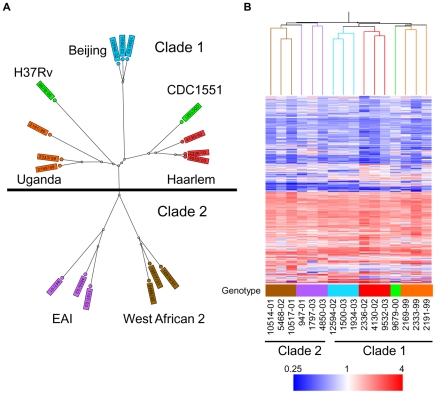
Figure 1. Genetic and transcriptome diversity of M. tuberculosis complex (MTC) clinical isolates.
(A) Radial neighbor-joining tree based on 24 loci MIRU-VNTR and 43 spacer spoligotyping showing the phylogenetic relationship of strains in this study. Three strains each from the 5 distinct lineages pathogenic to humans plus two sequenced reference strains (H37Rv and CDC1551) were chosen to represent the global diversity of MTC. The color used to denote each genotype is maintained in all subsequent figures for clarity. (B) Condition tree of MTC clinical isolate transcription profiles in vitro during log phase growth in 7H9 medium relative to CDC1551 reference strain (three biological replicates). Expression profiles for genes passing quality filters (flagged as present in 42 of 48 samples) with differential expression in at least one strain (up or down >1.5× in at least 1 of 16) were clustered using the Spearman correlation. Each column represents the global transcription profile of a single strain. Genes were clustered vertically based on the distance measure. Red and blue indicate higher or lower gene expression than CDC1551 control, respectively. Unless otherwise indicated, the color scale for expression (4-fold up or down) was used for all subsequent figures.

