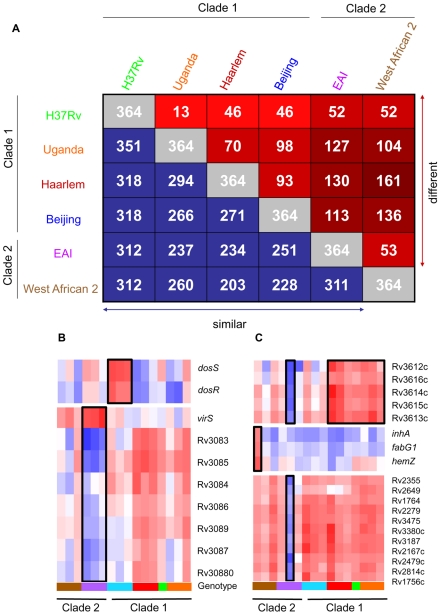
Figure 2. Identification of genotype- and strain- specific in vitro transcription profiles.
(A) Pair-wise comparison of genes with significant genotype-dependent expression. Includes genes identified by one-way ANOVA of quality-filtered geneset (present in 42 of 48 samples) using Benjamini and Hochberg False Discovery Rate (p<0.01). The matrix of intragenotype comparisons was generated by Tukey post hoc test. The numbers within red squares indicate genes with unique expression patterns between the two intersecting genotypes. (B) Gene tree of select virulence-associate transcriptional regulators with genotype-specific expression signatures. The dosRS two-component regulator, overexpressed in Beijing strains, controls the expression of ∼50 genes in response to multiple signals including nitric oxide, hypoxia, and carbon monoxide and is required for infection in animal models [20], [36], [70], [80], [81], [82], [83]. VirS is overexpressed in EAI strains with concomitant decreased transcript levels of the mymA operon (Rv3083-Rv3089). virS and mymA genes play a role in cell wall ultrastructure and are required for growth in activated macrophages and in mouse spleen [52], [53]. (C) Gene tree of select loci exhibiting strain-specific expression and profiles shared across multiple genotypes. Expression ratios indicated by color gradient are in vitro log phase transcript levels relative to CDC1551 reference strain (see Fig. 1B for color key).

