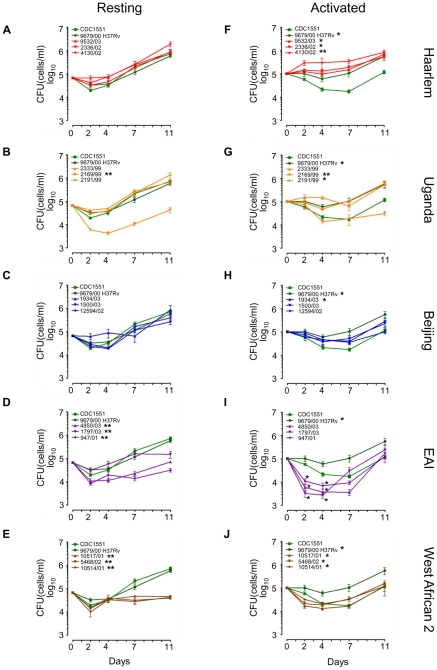
Figure 3. Long-term survival and growth of MTC clinical isolates in macrophages.
Resting (A–E) and IFN-γ + LPS activated (F–J) murine bone-marrow derived macrophages were infected at low MOI (∼1∶1) with MTC strains. Quantification of viable CFU at day 0,2,4,7, and 11 post-infection were conducted by lysis of monolayers, serial dilution, and plating on 7H10 medium. Error bars indicate standard error of the mean from two independent biological replicates each consisting of three technical replicates per strain (total of 6 wells/strain). Growth profiles of reference strains, H37Rv and CDC1551, are shown in green in all panels. Asterisks in the legend indicate strains determined to exhibit growth profiles significantly different compared to CDC1551 by ANOVA (* = p<0.05, ** = p<0.001). Although EAI strains did not reach p<0.05 when time was modeled as a continuous variable, modeling time as a nominal variable yielded differences of statistical significance at specific time points, indicated by asterisks at day 2 and day 4 in (I).

