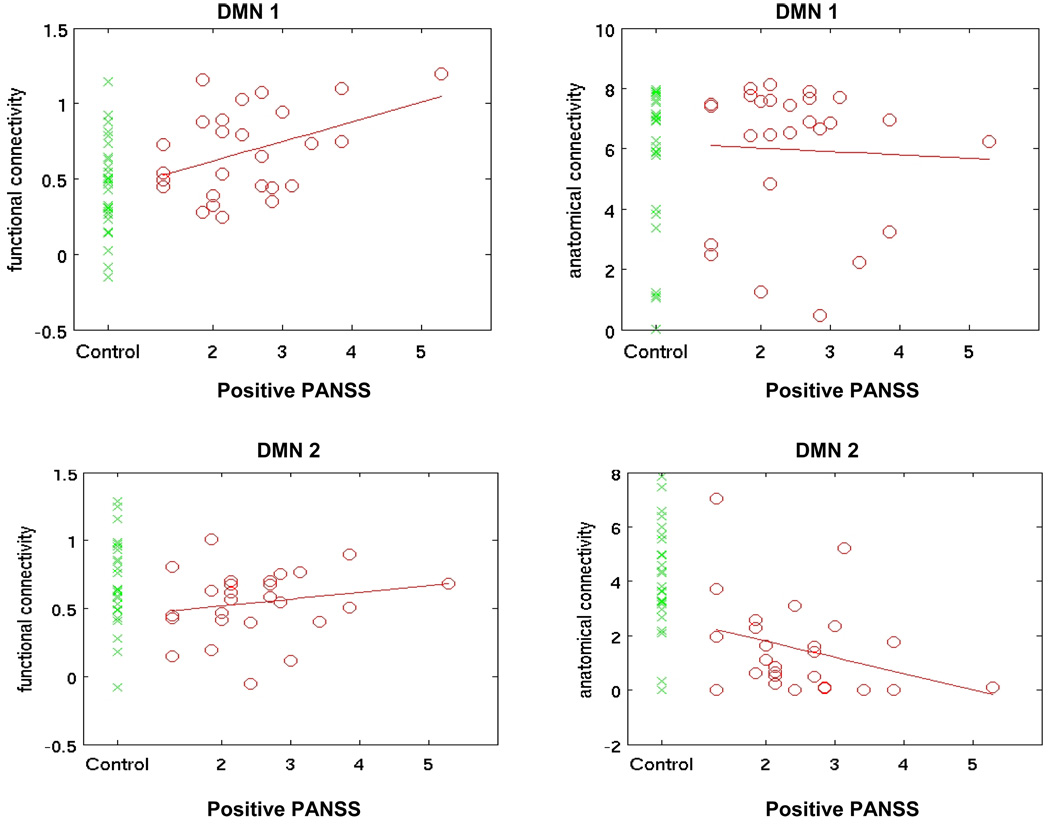
Figure 4.
Mean functional (left column) and anatomical (right column) connectivity averaged over all voxel pairs within the DMN-1 (top row) and DMN-2 (bottom row) subcomponent of Default Mode Network. Green crosses represent values for healthy controls. Only voxel pairs separated by distance of more than 24 mm are included in component averaging.

