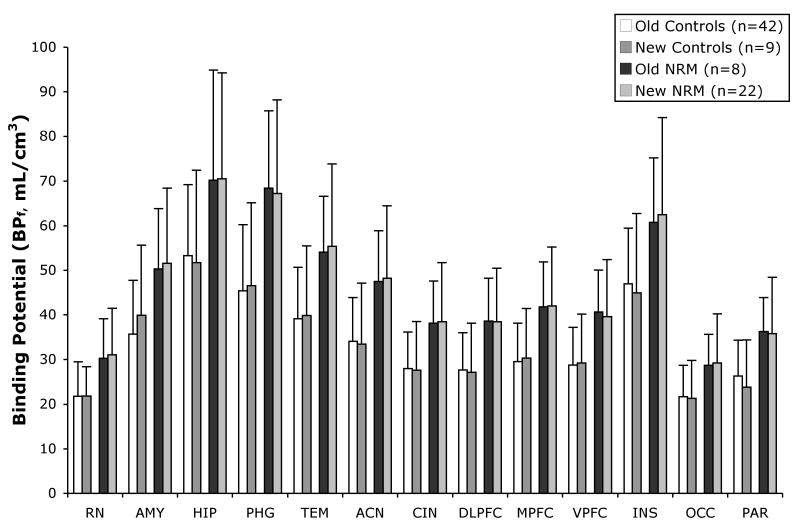
Figure 1.
Binding potential (BPF) differs in not recently medicated (NRM) subjects compared to controls in the old cohort (p=0.037) and new cohort (p=0.04). The height of the bars indicates the weighted mean BPF for each ROI (RN=raphe nuclei, AMY=amygdala, HIP=hippocampus, PHG=parahippocampal gyrus, TEM=temporal cortex, ACN=anterior cingulate, CIN=cingulate body, DLPFC=dorsolateral prefrontal cortex, MPFC=medial prefrontal cortex, VPFC=ventrolateral prefrontal cortex, INS=insula, OCC=occipital cortex, PAR=parietal cortex); the error bars represent the corresponding equivalent of the standard deviations of the weighted means for each ROI.

