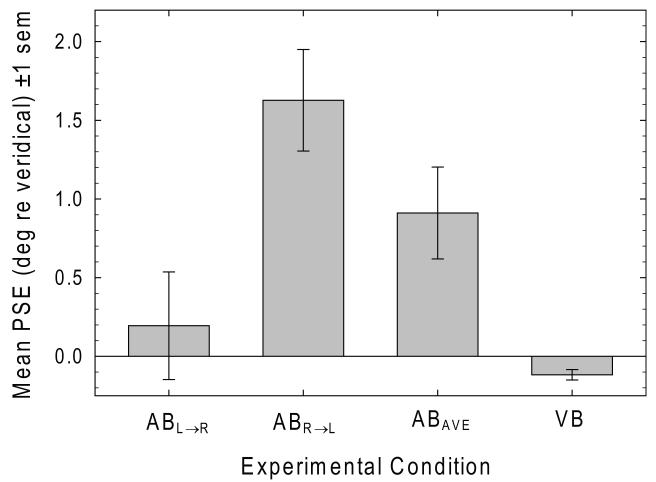
Figure 3.
Leftmost bars plot mean PSE in the ABL→R and ABR→L conditions. Mean PSE in the ABR→L condition is significantly rightward of the mean PSE in the ABL→R condition, indicating a significant effect of directional attentional scanning. Mean bisection error was significantly rightward of veridical in the ABR→L condition, but not in the ABL→R condition. The third bar plots the average bisection error in the AB condition. Average auditory bisection error deviates significantly rightward of veridical interval midpoint. The rightmost bar plots mean bisection error in the VB task, which deviates significantly leftward of veridical line midpoint.

