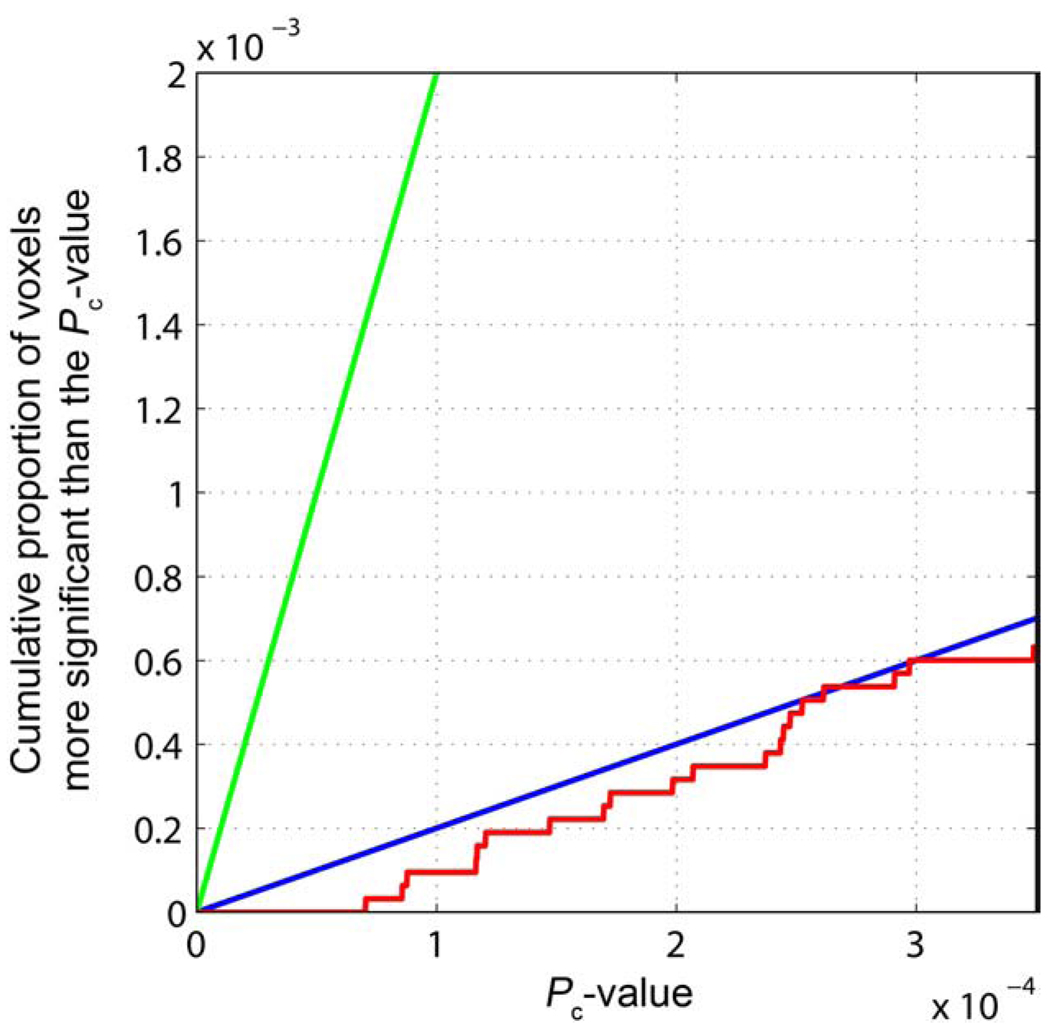
Fig. 3.
The cumulative distribution function of corrected P-values. The cumulative distribution function of Pc-values is shown (red) with two lines representing thresholds of q=0.50 (blue), and q=0.05 (green). (For interpretation of the references to colour in this figure legend, the reader is referred to the web version of this article.)

