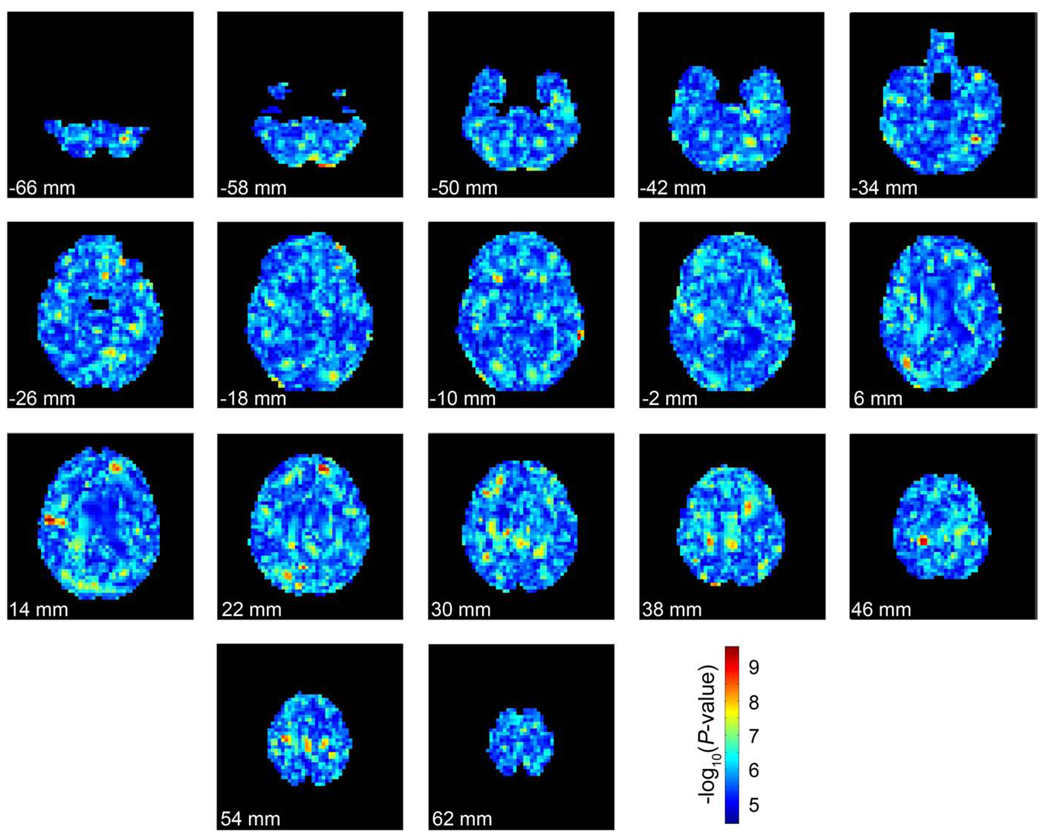
Fig. 5.
The significance of the most strongly associated SNP at each voxel in a single permuted dataset. Each image represents slices through the brain at 8 mm intervals from inferior to superior. The top of the page represents anterior of the brain and the bottom of represents posterior. The images are in radiological convention (left of the image is the right side of the subject). Each voxel is colored by the –log10 of the P-value of the genetic association at each point (warmer colors are more strongly associated). The same color scale is used from Fig. 4 for comparisons. (For interpretation of the references to colour in this figure legend, the reader is referred to the web version of this article.)

