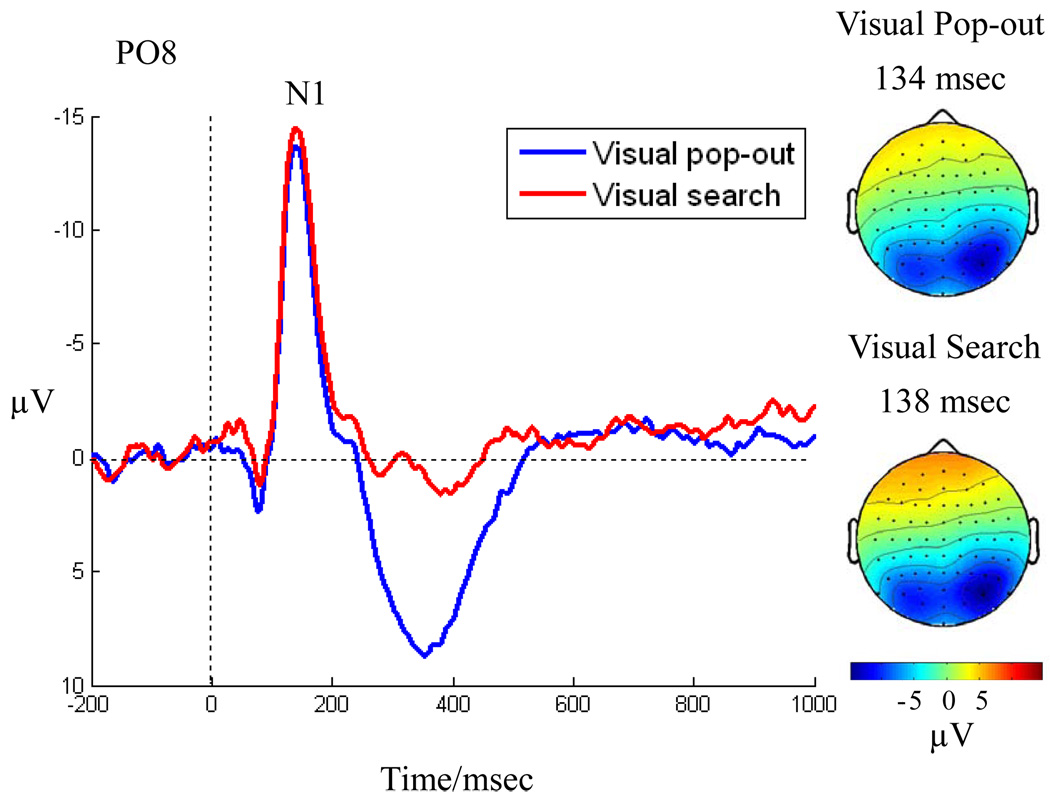
Fig. 3.
The N1 ERP effect is shown as a grand average in a right posterior occipital channel (PO8). Both pop-out (blue) and search (red) elicit an N1 around 130 msec. post-stimulus onset and the two do not differ significantly. The scalp distribution of the effect is shown in the right panel across all 64 electrodes at the latency of the N1 peak. Both pop-out (top) and search (bottom) show a posterior bilateral distribution. Also visible is a prominent occipital P300 component to pop-out that is absent in the visual search condition in this channel.

