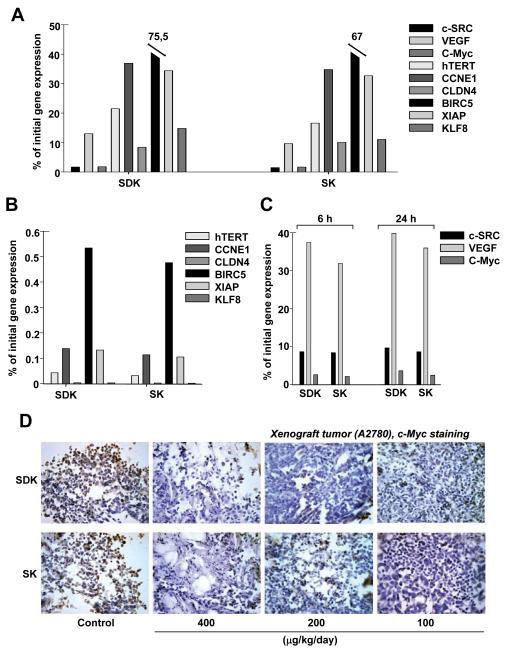
Figure 3.
Inhibition of Sp1 target genes by MTM derivates in vitro and in vivo. Expression of the indicated genes was measured by quantitative real-time RT-PCR and normalized to GAPDH. Similar results were obtained using B2M as reference. Results are presented as percentage of gene expression relative to the control group. (A) Gene expression in A2780 cells treated with the compounds in vitro for 24 h. (B) Gene expression in tumors from mice (n=3 per group) treated with 400 μg/Kg/day × 5 or vehicle and harvested 6 h after the last injection. (C) c-SRC, c-Myc and VEGF expression in tumors from mice (n=3 per group) treated as above and excised 6 and 24 h after the last injection. (D) c-Myc protein level assessed by immunohistochemical staining in tumors from mice (3 per group) treated as above and excised 6 h after last treatment. (DAB-H, X 40). In A, B and C standard errors were less than 10% of mean value. A, P <0.005. B and C, P <0.05.

