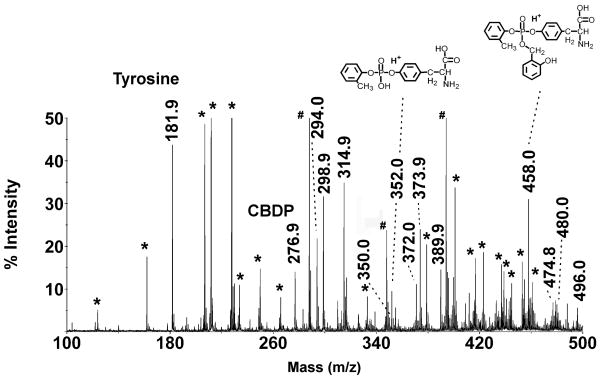
Figure 3.
MS spectrum from a mixture of tyrosine and CBDP, after 15.5 hours of reaction. Peaks marked by masses represent the reactants and the reaction products. The inserted structures are consistent with the indicated masses. Masses found in a mass spectrum of the buffer/matrix alone are marked by an asterisk (*). Three prominent, unassigned masses (at 288.0, 348.0 and 394.0 amu) are marked by a pound sign (#).

