Fig. 1.
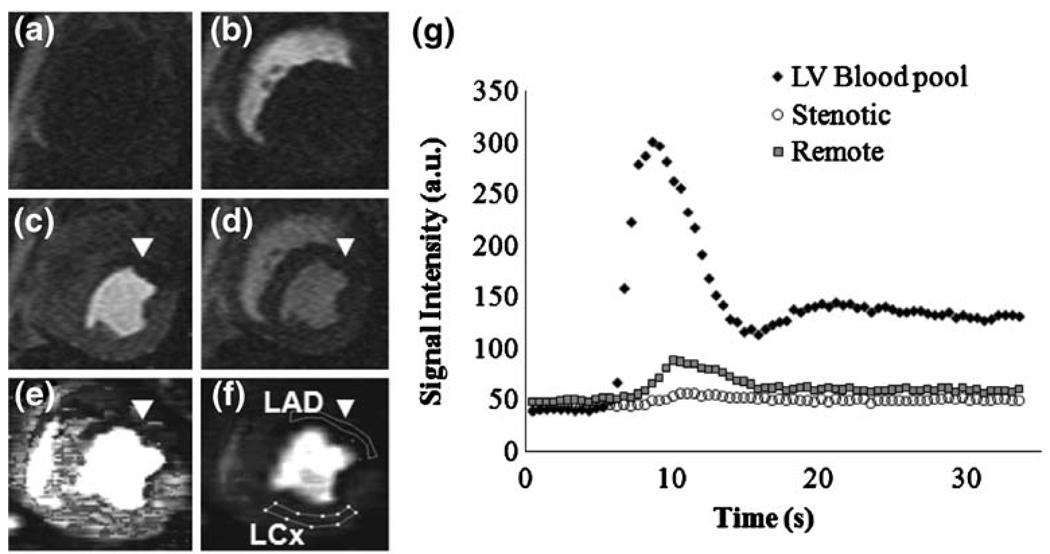
Representative short-axis images of a dog with a 95% LAD stenosis (a–f), and a signal intensity plot during the Gadomer bolus (g). a Baseline before Gadomer bolus. b First-pass of contrast material enters the right ventricle. c First-pass into the LV. d After first-pass. MBF map e and MBV map f showing LAD (unmarked lines) and LCx regions of interest (marked lines). Coronary stenosis caused an area of hypointensity (poor perfusion) in the anterior LAD-perfused myocardium(arrowheads). g Plot of signal intensity vs. time confirming poor contrast enhancement in the myocardium affected by the coronary stenosis

