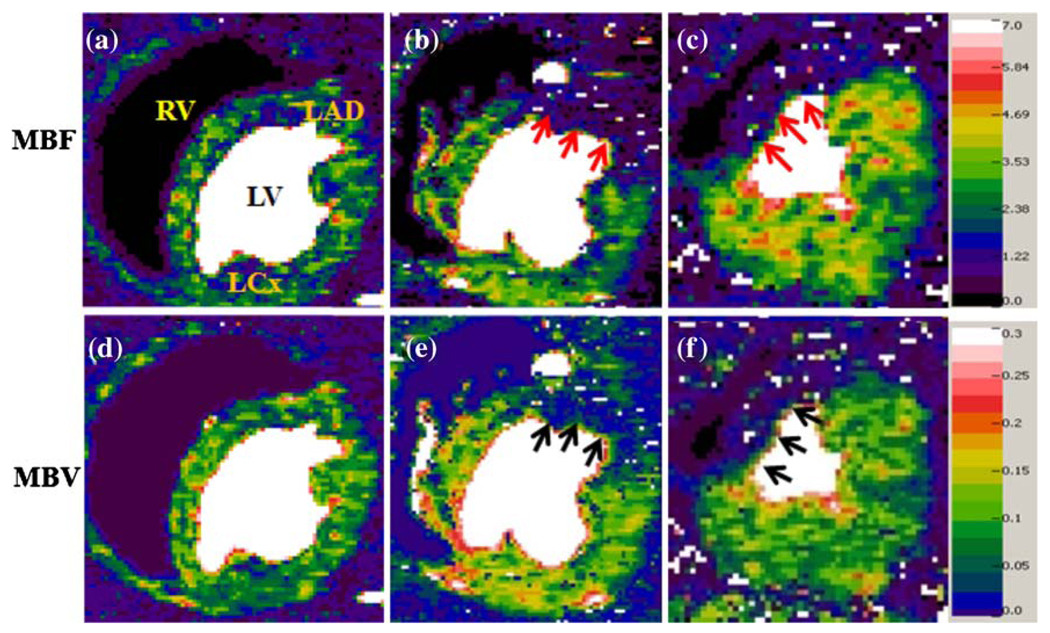
Fig. 4.
Examples of MBF and MBV maps with different stenosis severity during dobutamine-induced hyperemia: normal (a and d), moderate stenosis (b and e), and severe stenosis (c and f). The color scale for MBF is from 0 to 7 mL/min/g and for MBV from 0 to 0.3 mL/g or 30 mL/100 g. MBF in the LAD-subtended regions (b and c) shows similar reduction for both moderate and severe stenosis (arrows), but MBV in the same regions (e and f) reveals difference with slightly lower intensity in map (f) (arrows)

