Abstract
This study investigates how the microstructural properties of trabecular bone affect suture anchor performance. Seven fresh-frozen humeri were tested for pullout strength with a 5 mm Arthrex Corkscrew in the greater tuberosity, lesser tuberosity, and humeral head. Micro-computed tomography analysis was performed in the three regions of interest directly adjacent to individual pullout experiments. The morphometric properties of bone mineral density (BMD), structural model index (SMI), trabecular thickness (TbTh), trabecular spacing (TbS), trabecular number (TbN), and connectivity density were compared against suture anchor pullout strength. BMD (r = 0.64), SMI (r = -0.81), and TbTh (r = 0.71) showed linear correlations to the pullout strength of the suture anchor with p-values < 0.0001. A predictive model was developed to explain the variances in the individual BMD, SMI, and TbTh correlations. The multi-variant model of pullout strength showed a stronger relationship (r = 0.86) compared to the individual experimental results. This study helps confirm BMD is a major influence on the pullout strength of suture anchors, but also illustrates the importance of local microstructure in pullout resistance of suture anchors.
Keywords: Suture Anchors, Pullout Strength, Micro-CT, Microstructure, Bone Mineral Density
Introduction
Suture anchors are designed to fix soft tissues, such as tendons and ligaments, to bone. Suture anchors can be used in numerous surgical procedures including rotator cuff repairs,(McFarland et al. 2005) bicep tenodesis,(Kettler et al. 2007) flexor tendon repair,(Matsuzaki et al. 2008) and patellar tendon ruptures.(Capiola and Re 2007). In 2007, over 1,030,000 suture anchors were used in 460,000 shoulder procedures in the US alone.(Millennium_Research_Group 2007)
The success and revision rates of suture anchor in rotator cuff repairs have previously been reported. In one study of rotator cuff repair, failure occurred in 10% of 80 cases as a result of anchor loosening or migrating.(Djurasovic et al. 2001) Kaar et al. reviewed 8 failed shoulder repair cases and found 2 suture anchors originally implanted in the humeral head to be free-floating, which led to severe articular damage.(Kaar et al. 2001) In another study, failure occurred in 6.5% of 342 rotator cuff repairs and underwent revision surgery.(Cummins and Murrell 2003) During revision of the 22 cases, only 1 patient was identified to have a loose implant with the majority of the remainder caused by tissue failure with the suture tearing from the tendon; however, migration of the implants was not monitored and could have been a contributing factor to suture-tendon tear. In a cost-effectiveness study, the average rotator cuff repair had a total cost of $10,605 for hospital and physician costs.(Vitale et al. 2007) As a result, for every 1% of repairs requiring revision, annual cost of revision repair is estimated at $48,783,000 in the US.
The pullout strength of suture anchors has consistently been investigated. Continually updated comparisons of suture anchor strengths and failure modes are published by Barber et al..(Barber 2007; Barber and Herbert 1999; Barber et al. 2008; Barber et al. 1997b; Barber et al. 2006) Other researchers have been able to predict the pullout strength of anchors in synthetic bone by using both shear and bearing area relationships.(Chapman et al. 1996; Yakacki et al. 2009) While these previous studies try to maintain uniform synthetic and cadaveric bone properties to effectively compare and predict pullout strength across a variety of suture anchors, biological factors can complicate a repair. With regards to rotator cuff tears, it has been shown that delayed repair and the resultant decrease in exposure to biomechanical stress results in disuse osteopenia.(Cadet et al. 2008; Galatz et al. 2005) Furthermore, an investigation into asymptomatic patients showed 54% of 46 individuals over 60 years of age exhibited evidence of rotator cuff tears using MRI imaging.(Sher et al. 1995) Poor bone and tissue quality are the main factors of anchor-bone and suture-tendon pullout, respectively, and research has been focused on the use of suture anchors in the aging population.(Rebuzzi et al. 2005)
Several researchers have attempted to link the properties of bone to suture anchor pullout strength. An early study by Barber et al. could not correlate bone mineral density (BMD) to pullout strength.(Barber et al. 1997a) A later study by Tingart et al. focused more on regional variability using computed tomography (CT), and showed correlation of increased pullout strength in areas of higher BMD.(Tingart et al. 2004) These results also showed that BMD and pullout strength increased in the proximal-anterior portion of the greater tuberosity; however, since this study, limited work has been performed investigating the relationship between microarchitecture and pullout strength in these regions. Recently, Meyer et al. showed a convincing linear relationship between pullout strength of an Arthrex BioCorkscrew and a custom PLA implant to BMD measured by micro-CT (μCT) with a 78 μm resolution.(Meyer et al. 2006)
A more detailed characterization of bone microstructure can be achieved with μCT; however, to the best of the authors' knowledge, this has not been investigated in regards to suture anchor performance. Using high resolution scans and microstructural factors such as trabecular spacing, thickness, and shape can accurately be quantified and compared in conjunction with BMD. Therefore, the purpose of this study was to investigate how the microstructural properties of trabecular bone influence suture anchor pullout strength.
Materials and Methods
Materials
Seven fresh-frozen human humeri ranging from 36 to 84 years old (mean of 72 years) were received from Science Care (Phoenix, AZ) and stored at -20°C. Each humerus was thawed to room temperature before testing and sample extraction. After thawing, soft tissue remnants were removed from the humeral head and the tuberosities. In order to perform testing in only trabecular bone, the cortical layer was removed using a burring tool. This procedure was performed similarly to methods previously tested by Barber et al. when testing bone troughs and helped replicate clinical conditions in which the cortical layer is removed to create a bleeding response.(Barber et al. 2006; Barber et al. 2008)
Methods
Pullout Testing
Pullout tests were performed on an Instron 5567 universal testing machine. A self-tapping 5mm Arthrex Corkscrew anchor (Ømaj = 5mm, L = 20mm) was threaded with sutures (CP Medical, CP Fiber #2) and inserted perpendicular and flush to the surface of one of five testing sites on the humerus in the greater tuberosity, lesser tuberosity, and humeral head (Figure 1). The humerus was secured onto a custom mount and visually aligned so that the crosshead pulled along the axis of the anchor and perpendicular to the bone surface (Figure 2). Pull-to-failure tests were performed with a starting preload of 1N and crosshead speed of 1 mm/sec. Failure load and failure method was recorded for each pullout test (Figure 3). In total, 35 pullout tests were performed on seven humeri.
Figure 1.
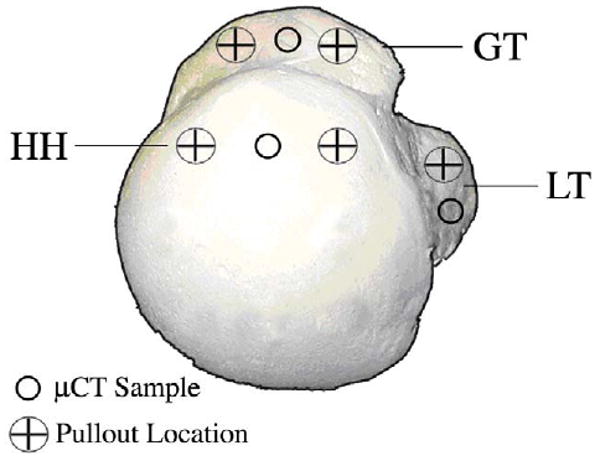
Superior view of the humeral head with marked locations of μCT sampling and pullout testing.
Figure 2.
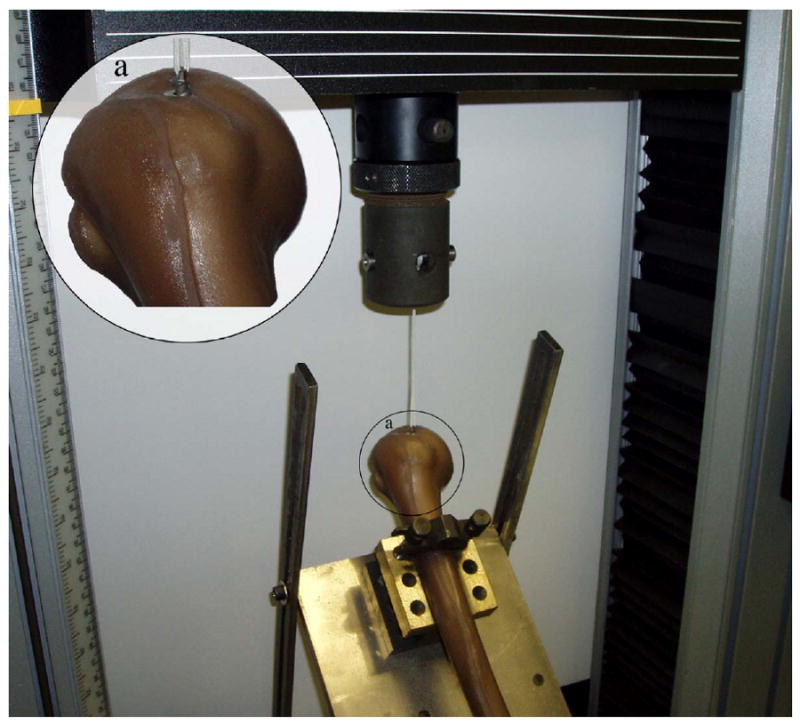
Suture anchor pullout test setup. The anchor was installed perpendicular to the bone surface and the custom holding mount allowed for pullout to be achieved along the axis of insertion. In the magnified section (a), the Corkscrew device can be seen partially implanted into a synthetic humeral head.
Figure 3.
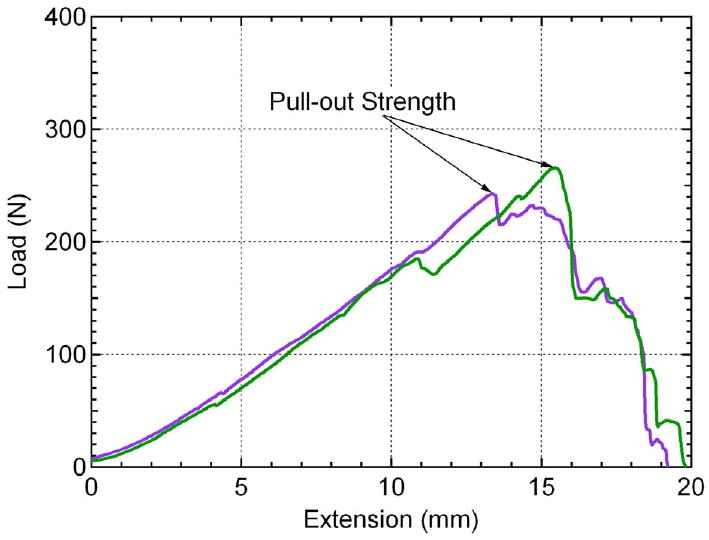
Two example load-extension curves acquired from pullout testing. The pullout strength is determined at the maximum value of the curve. The linear loading of the curve leading up to anchor pullout is due to the length and compliance of the suture material (i.e. suture stretching).
Sample Extraction for μCT
Due to sample size limitations of the μCT machine, the entire humerus could not be scanned prior to testing. Therefore, sample extraction was performed after completion of the pullout tests. The humerus was removed from the mount and any debris from the tests was wiped clean. The humerus was then cut at the surgical neck and anatomical neck to help aid in the sample extraction process. A custom made punch with a 5mm diameter and a length of 40mm was inserted into the designated sites (Figure 1). After extraction, each sample was cut to 10 mm length utilizing the portion closest to the surface and analyzed using μCT. 21 samples were extracted from seven humeri.
μCT Analysis
Trabecular bone samples were scanned using a μCT 40 (Scanco Medical, Brüttisellen, Switzerland), which is a benchtop conebeam micro-computed tomography system with a microfocus X-ray source. Scan settings used were E = 55kVp, I = 145μA, integration time = 300ms, and 12μm isotropic voxel size. Raw data were reconstructed to 2D tomograms using an automatic convolution back-projection algorithm. Manual contouring was used to define outer boundaries of the trabecular bone specimens. Global thresholding was then applied to segment material from the background to create 3D binarized images of the material structure. With these 3D images, assessment of morphometric parameters, including bone volume, volume fraction, average trabecular thickness (TbTh), spacing (TbSp), and number (TbN), and structural model index (SMI), was performed using direct distance transformation methods. (Hildebrand et al. 1999) Connectivity density was computed and defined as a volumetric measure of redundancy in solid interconnections. (Odgaard and Gundersen 1993)
Average material density was defined as an average of the X-ray absorption values for only the solid voxels. The values were calibrated to mineral density values using phantoms of known hydroxyapatite concentrations. Bone mineral density was calculated by multiplying the fraction of bone volume to total volume by the average material density.
Statistics
A sample size of 35 was collected. The μCT data collected for the humeral head and greater tuberosity samples each correspond to two pullout tests, while lesser tuberosity samples correspond to a single test. Pullout data was analyzed against BMD, SMI, TbN, TbSp, TbN, and connectivity density. A Grubbs tests was used to detect any outliers in the microstructural properties. BMD, TbN, and connectivity density in the humeral head of the youngest donor had z-values greater than or equal to 2.50 and thus were excluded from the regression analysis for these properties, however, these data are still shown in the figures and are represented as the highest pullout value from the humeral head. Linear regression was fit to each microstructural property and residual plots showed no significant deviations from normal distribution. Pearson coefficients (r) were calculated in order to evaluate linear correlation of μCT variables against pullout strength. T-statistics were computed using n-2 degrees of freedom and were tested against an alpha value of 0.01. The null hypothesis used was that each μCT variable is significantly correlated to pullout strength. The null hypothesis was accepted if p < 0.01 and rejected if p ≥ 0.01.
Results
Pullout testing and μCT analysis were performed on the greater and lesser tuberosities and the humeral head in seven cadaver specimens. All anchors failed due to anchor pullout. Four representative samples of the range of bone specimens tested can be seen in Figure 4 with their corresponding microstructural properties listed in Table 1. Average values and standard deviations of the microstructural parameters along with donor information can be seen in Table 2. These data serve to illustrate the range of values of each parameter in the three test locations of the humerus.
Figure 4.
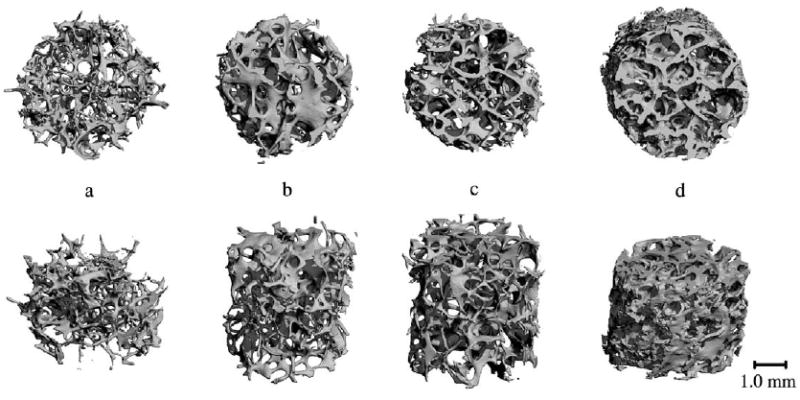
Representative μCT scans of four cadaver specimens with varying microstructural properties. Top row of images represents top view while bottom row represents front view. Values of microstructural parameters can be seen in Table 1. Sample A came from a 75 year old female (Table 2, row 3), samples B and C came from an 81 year old male (Table 2, row 4), while sample D came from a different 81 year old male (Table 2, row 5).
Table 1.
Values of microstructural parameters of the four specimens represented in Figure 4.
| Specimen | a | b | c | d |
|---|---|---|---|---|
| Location | GT | GT | HH | HH |
| BMD (mg/cm3) | 162.9 | 92.5 | 108.1 | 220.8 |
| SMI | 2.54 | 2.14 | 1.78 | 1.19 |
| Trabecular Thickness (mm) | 0.121 | 0.111 | 0.106 | 0.151 |
| Trabecular Spacing (mm) | 0.66 | 0.83 | 0.79 | 0.73 |
| Trabecular Number (1/mm) | 1.46 | 1.12 | 1.19 | 1.36 |
| Conn Den. (1/mm3) | 6.92 | 3.64 | 4.34 | 8.98 |
| Average Pullout (N) | 51.2 | 64.5 | 161.8 | 212.1 |
Table 2.
Donor information for the study along with mean microstructural parameters and standard deviations from the three test locations marked in Figure 2. Data is divided with respect to a). donor (n=3) and b). region tested (n=7). Table 2b also shows statistically significant differences between populations that were calculated using a student t-test.
| Table 2a | |||||||
|---|---|---|---|---|---|---|---|
| Age | Sex | BMD (mg/cm3) | SMI | Tb. Th. (mm) | Tb.S. (mm) | Tb. N.(1/mm) | Conn. Den. (1/mm3) |
| 36 | M | 221.0 ± 108.7 | 1.55 ± 0.81 | 0.128 ± 0.033 | 0.48 ± 0.07 | 1.95 ± 0.30 | 17.85 ± 6.93 |
| 66 | M | 178.9 ± 82.4 | 1.73 ± 0.50 | 0.114 ± 0.034 | 0.53 ± 0.08 | 1.78 ± 0.24 | 12.17 ± 3.25 |
| 75 | F | 157.6 ± 10.2 | 1.57 ± 0.59 | 0.128 ± 0.006 | 0.73 ± 0.11 | 1.29 ± 0.16 | 4.72 ± 0.53 |
| 81 | M | 119.0 ± 33.4 | 1.81 ± 0.32 | 0.115 ± 0.010 | 0.79 ± 0.05 | 1.18 ± 0.06 | 4.03 ± 0.35 |
| 81 | M | 152.9 ± 67.4 | 1.68 ± 0.32 | 0.120 ± 0.017 | 0.79 ± 0.09 | 1.57 ± 0.26 | 5.15 ± 3.90 |
| 83 | F | 181.6 ± 73.5 | 2.18 ± 0.37 | 0.120 ± 0.043 | 0.63 ± 0.06 | 1.39 ± 0.08 | 9.26 ± 0.92 |
| 84 | M | 132.5 ± 58.7 | 1.59 ± 0.53 | 0.125 ± 0.024 | 0.67 ± 0.13 | 1.25 ± 0.18 | 5.58 ± 3.00 |
| Table 2b | |||||||
| GT | LT | HH | |||||
| BMD (mg/cm3) | 126.1 ± 38.6 | 137.7 ± 16.7 | 226.3 ± 76.0 | ||||
| SMI | 2.11 ± 0.30 | 1.80 ± 0.30 | 1.28 ± 0.43 | ||||
| Tb. Th. (mm) | 0.110 ± 0.017 | 0.110 ± 0.012 | 0.144 ± 0.022 | ||||
| Tb.S. (mm) | 0.71 ± 0.15 | 0.64 ± 0.10 | 0.63 ± 0.17 | ||||
| Tb. N. (1/mm) | 1.38 ± 0.26 | 1.50 ± 0.27 | 1.58 ± 0.43 | ||||
| Conn. Den. (1/mm3) | 7.00 ± 4.36 | 7.28 ± 4.07 | 11.07 ± 7.56 | ||||
statistically significant on with aipha= 0.01.
statistically significant with alpha = 0.05
Three of the microstructural parameters, BMD, SMI, and trabecular thickness, showed a linear correlation to pullout strength with 99% confidence. Pullout strength was shown to increase with increasing BMD (r = 0.64, p < 0.0001; Figure 5a). Suture anchors tested from the humeral head showed higher values of BMD and pullout strength than those tested in the greater and lesser tuberosities. Pullout strength showed the highest correlation to SMI (r = 0.81, p < 0.0001; Figure 5b). SMI is a measure of plate- or rod-like characteristics of the trabecular structure. Ideal plate and rod structures have values of 0 and 3, respectively. Pullout strength increased as SMI decreased and the trabeculae became more plate-like. Samples from the greater tuberosity had the highest SMI values and were the closest to an ideal rod structure. Trabecular thickness showed a similar proportional correlation to pullout strength as BMD (r = 0.71, p < 0.001; Figure 5c). Trabecular thickness and BMD of the samples were analyzed to be highly correlated to each other (r = 0.80, p < 0.0001) and may explain the similarity in trends. However, SMI could not be correlated to BMD or TbTh. The data supports that the pullout strength in the humeral head was higher than the greater and lesser tuberosities because the humeral head had a higher BMD and thicker trabeculae with a more plate-like structure.
Figure 5.
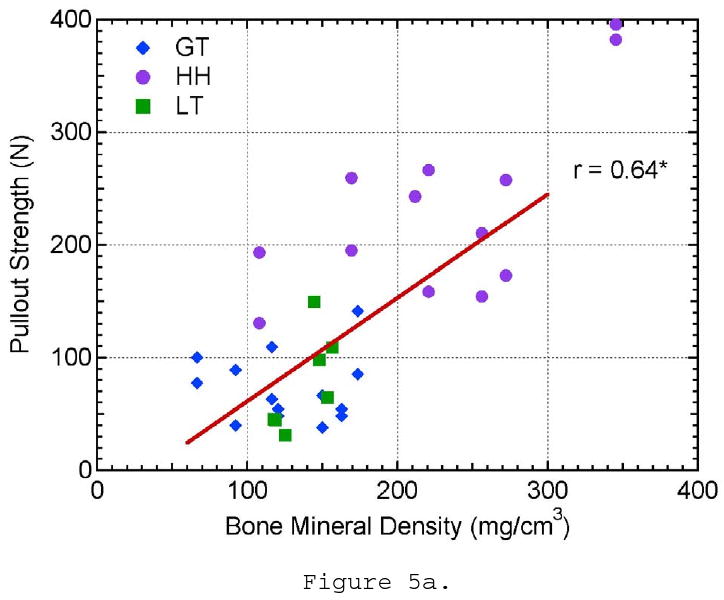
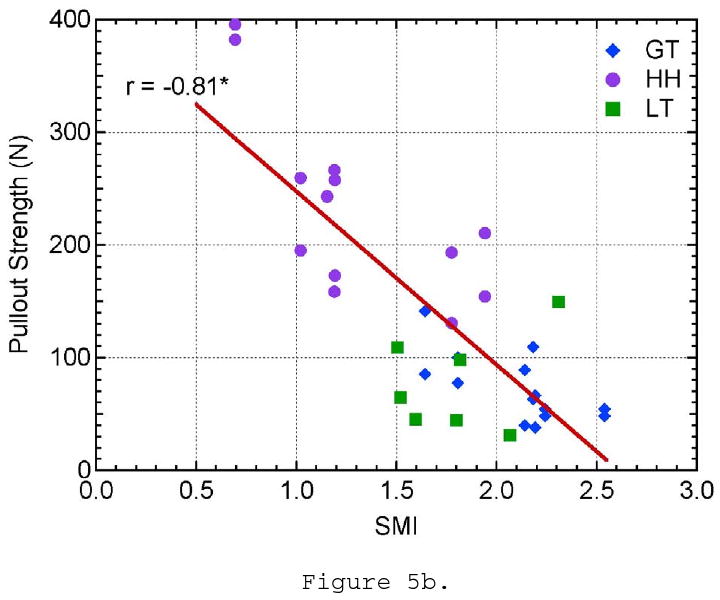
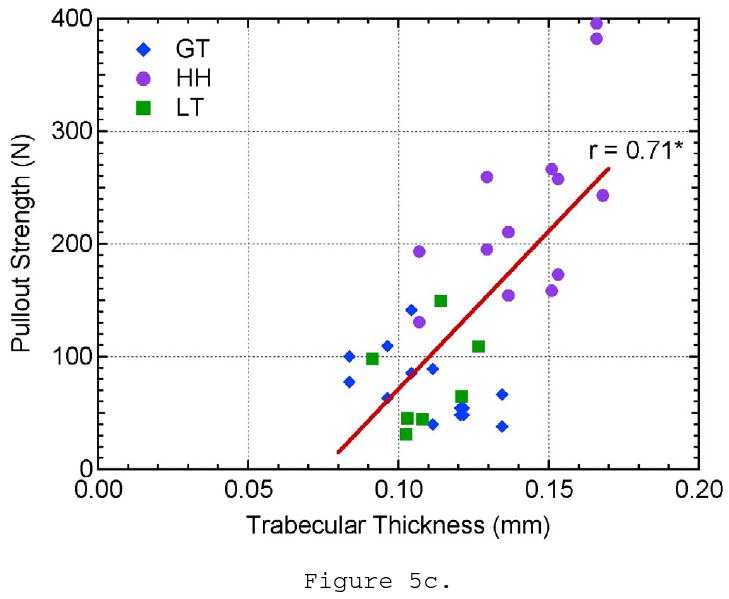
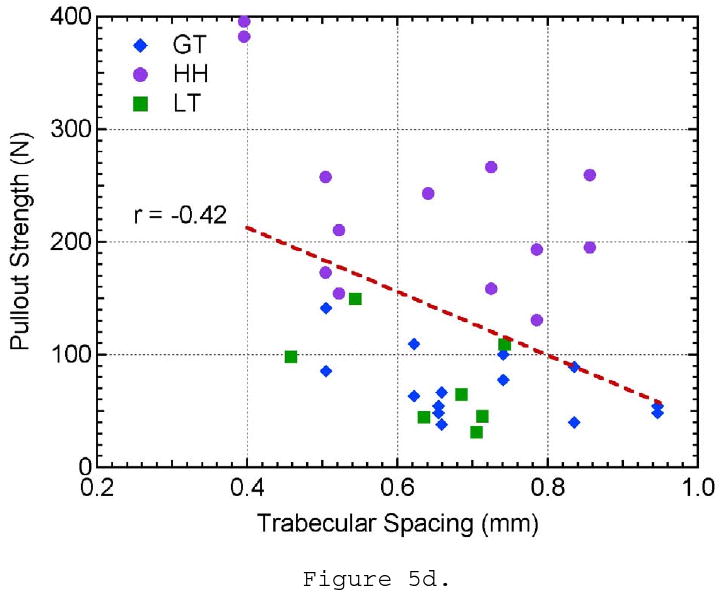
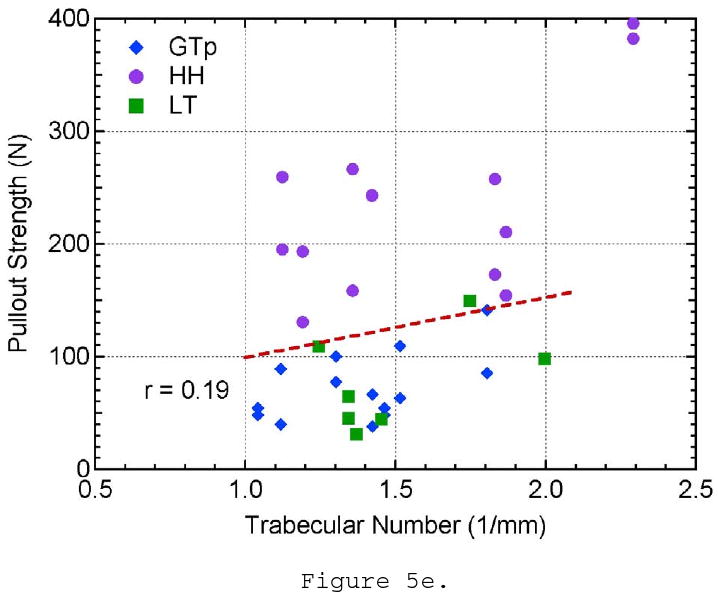
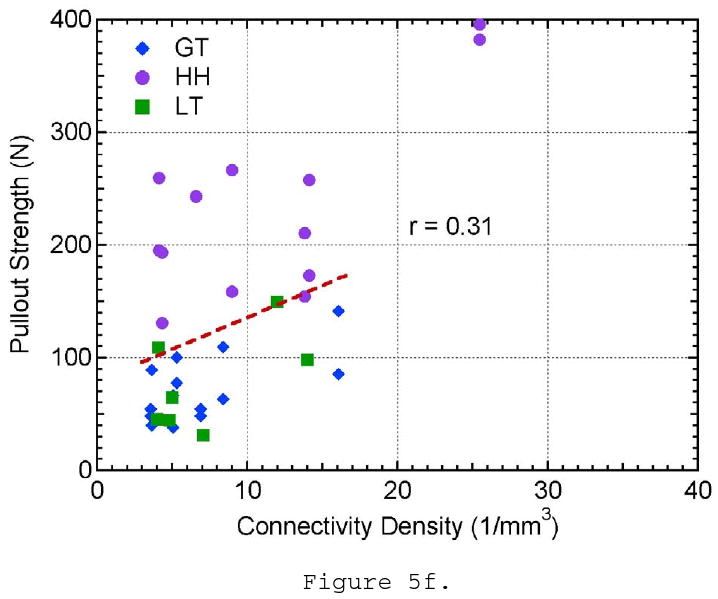
The effect of a) bone mineral density, b) structural material index, c) trabecular thickness, d) trabecular spacing, e) trabecular number, and f) connectivity density on pullout strength.
The remaining morphometric parameters, TbSp, TbN, and connectivity density, did not show a significant correlation to pullout strength. Though the trabecular spacing of the bone ranged from approximately 0.4 to 1.0 mm, there is no evident distinction between the three locations tested and pullout strength (Figure 5d). Trabecular number showed little variation between all of the specimens and locations tested and did not show any influence on pullout strength (Figure 5e). The connectivity density showed a larger variation within the samples taken from the humeral head location; however, it did not show a relationship to pullout strength (Figure 5f). These three parameters are essentially three different ways to measure the linear or volumetric density of the trabeculae. These properties were highly correlated to each other (r- values), which might help explain why they all fail to show correlations to pullout strength. It should also be noted that as TbSp decreases and TbN increases, connectivity density increases approximately by a power of three (∼x3) as it is a 3-D measure of density. This helps explain why the youngest donor has a significantly higher connectivity density in the humeral head compared to the remaining sample population. The r- and p-values for all of the pullout strength comparisons can be seen in Table 3.
Table 3.
r- and p-values for linear regressions tested in Figures 5a-f. Correlations with r ≥ 0.51 correspond to a two-tailed 1% level of significance.
| Variable | r-Value | p-Value |
|---|---|---|
| Bone Mineral Density | 0.64 | < 0.0001 |
| Structural Material Index | -0.81 | < 0.0001 |
| Trabecular Thickness | 0.71 | < 0.0001 |
| Trabecular Spacing | -0.42 | 0.012 |
| Trabecular Number | 0.19 | 0.2743 |
| Connectivity Density | 0.31 | 0.0699 |
The three morphometric parameters that were shown to influence pullout were then analyzed to create a multi-variant predictive model. Pullout strength was modeled by the equation:
| (1) |
where a0, b0, and c0 are curve fitting coefficients and were determined to be 5.500 × 10⁻¹, 5.788 × 101, and 1.149 × 10³, respectively. The microstructural data was applied to the model (Eq. 1) and the predicted values were compared against the experimental data (Figure 6). The comparison of predicted versus experimental pullout values follows an ideal linear relationship (y = x) and yields a significant correlation (r = 0.86, p < 0.0001). This model helps explain some of the variances within the results by accounting for three microstructural parameters simultaneously. It improves the correlation coefficient from the highest individual correlation in this study was between pullout strength and SMI.
Figure 6.
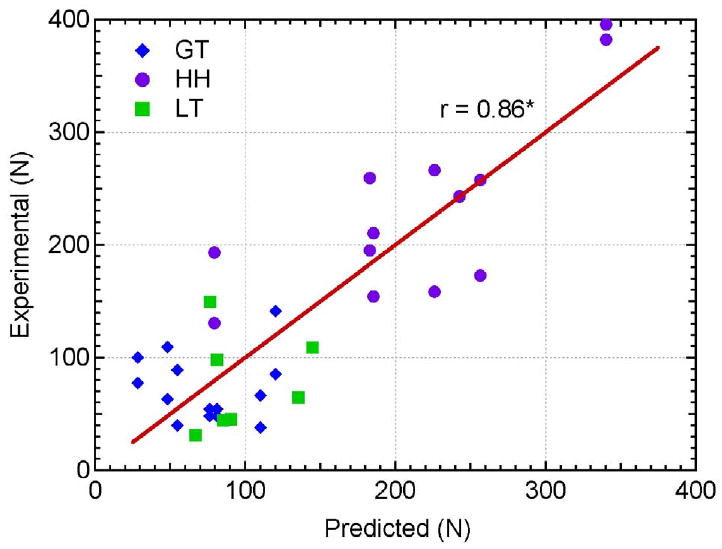
Relationship between the experimentally measured pullout strength values and predicted pullout strength values calculated by the developed model (Eq. 1).
Discussion
This study investigated the influence of microstructural parameters of the trabecular structure on the pullout strength of a suture anchor. It was hypothesized that in a more complete characterization of trabecular bone, pullout strength would be influenced by more than just BMD alone. Pullout testing and μCT analysis were performed on seven specimens at three locations of interest on the humeral head.
Three of the morphometric parameters demonstrated a linear correlation with pullout strength. BMD and trabecular thickness were significantly correlated with r-values of 0.64 and 0.71 and p < 0.0001, respectively. SMI showed the strongest correlation to pullout strength with an r-value of 0.81. Of the three sites tested, the pullout strength was the highest in the humeral head compared to the greater and lesser tuberosities. Pullout strength in the greater and lesser tuberosities was approximately equal. The data advocates that bone with higher BMD, thicker trabeculae thickness, and a more plate-like structure (lower SMI) will yield higher pullout strength than their counterparts. This trend is best observed when examining the properties of the representative samples in Figure 4. Samples B, C, and D show an increase in pullout strength with increasing BMD and decreasing SMI. It is important to look at all of the relevant microstructural parameters upon comparison. One might have predicted sample A to have a higher pullout strength compared to samples B and C based on BMD alone. However, because sample A displayed a rod-like structure denoted by its high SMI value, it yielded lower pullout strengths than samples B and C despite having a higher BMD. It is also important to note that SMI did not show a significant level of correlation to BMD or TbTh and should be taken into account when assessing the properties of bone. The model developed in Eq. 1 helped take into account the three influential microstructural parameters and showed a strong correlation to the experimental results (Figure 6). Other microstructural properties such as trabecular spacing, trabecular number, and connectivity density were not shown to significantly influence pullout strength.
This study is in agreement with findings of Meyer et al., in which BMD was correlated to an Arthrex Biocorkscrew and a prototype polylactic acid anchoring device using the same testing regions in the humerus.(Meyer et al. 2006) Their results of cancellous BMD having a linear relationship to pullout strength is consistent with the data presented in Figure 5a and helps serve as validation for both their study and the present study. However, our study was performed at a higher resolution, 12μm compared to 78μm, and allowed for a more detailed analysis of trabecular morphology. To the best of the authors' knowledge, no other study has compared the complete microstructural parameters to the pullout strength, though studies have been performed to characterize microstructural parameters to compressive strength of bone.(Goulet et al. 1994) Positive correlations to pullout were exhibited by several morphometric parameters, and it is suggested that future suture anchor pullout studies incorporate more detailed μCT analysis.
The delineation of true trabecular microstructure and its correlation to suture anchor pullout strength has several important clinical applications. Firstly, by understanding the relationship of trabecular microstructure to the strength of suture anchor fixation, it provides clinicians with the opportunity to not only understand fixation failure, but to develop improved fixation devices that incorporate trabecular microstructure fixation into their design. The utilization of μCT allows a more complete understanding of osteopenic bone microstructure and will help to guide not only implant design but implant location on the anatomic footprint of the rotator cuff. This work may extend well into other areas in which fixation is required in trabecular bone, particularly when the patient suffers from osteopenia. Examples of this include patients with severe foot deformities. Anchors are used to reroute tendons in the foot and ankle, which suffer from low BMD due to lack of walking and weight bearing. Furthermore, hip screws and nails are fixated in trabecular bone and are commonly used to treat fractures as the result of the elderly falling.
Further applications of μCT of trabecular and cortical bone include correlation of suture anchor failure to trabecular microstructure in a cadaver model in order to investigate cyclic tangential loading after rotator cuff repair. This would be done in an attempt to replicate a more anatomic mode of failure. μCT evaluation of trabecular bone can be beneficial in the study of fixation devices in other anatomic areas that have shown a relationship between BMD and fixation failure such as pedicle screws in spinal fixation (Jacob et al. 2008) as well as tibial and humeral fracture fixation.(Ali et al. 2006; Tingart et al. 2006)
The limitations of this study should be noted. First, this study does not take into account the presence of the cortical layer, which was removed before testing. The presence of a cortical layer would increase the pullout strength of the suture anchors. Patients with a healthy cortical layer are more prone to experience suture breakage or suture-tendon tearing as a mode of failure rather than suture anchor pullout. However, many suture anchors are implanted below the cortical layer and rely on trabecular fixation alone. This can be due to surgeon technique or patient anatomy, both of which vary from case to case. In this scenario, the anchor may migrate a small distance under tension before securing itself against the cortical shell. However, this could still be considered a clinical failure if tension is lost between the anchor and rotator cuff or the top of the anchor protrudes from the surface during migration. Lastly, many clinicians will burr away cortical layer at the site of implantation to induce a bleeding/healing response in the bone. The removal of the cortical layer in this study allowed the effect of microstructural parameters to be directly related to one another while still maintaining clinical relevance. Future research is still needed to assess how the load-sharing and microstructural properties of the cortical layer influences pullout strength as well as to examine the trade-offs between the removal of the cortical layer to the reduction in fixation strength and potential damage to the underlying trabeculae.
The pullout testing sites were taken adjacent to the sites taken for μCT analysis and do not account for small regional variations in the testing locations. This is likely to attribute to some of the variances within the testing data. The correlations would likely have been strengthened if non-destructive μCT could have been performed at the testing site before pullout testing. Due to sampling size limitations of the μCT machine, the entire humeral head could not have been scanned to the resolution. CT scans could have been performed on the entire humeral head to check for any abnormal regional variability in the testing locations. Lastly, this study and model did not take into account the degree of anisotropy, which may affect the pullout strength of suture anchors with regards to orientation and direction.
Conclusions
μCT analysis was performed on the trabecular bone of humeral heads and compared to the pullout strength in the humeral head, greater tuberosity, and lesser tuberosity. Pullout strength was linearly correlated to BMD, SMI, and trabecular thickness. Pullout strength was highest in samples tested in the humeral head. The study showed that pullout strength is highest in bone with a higher BMD, thicker trabeculae, and more plate-like structure.
Acknowledgments
The authors would like to thank Kurt Jacobus PhD for his help and support of this study. This study was funded in part by the NIH/NIAMS (1R43/2R44-AR056154).
Footnotes
Publisher's Disclaimer: This is a PDF file of an unedited manuscript that has been accepted for publication. As a service to our customers we are providing this early version of the manuscript. The manuscript will undergo copyediting, typesetting, and review of the resulting proof before it is published in its final citable form. Please note that during the production process errors may be discovered which could affect the content, and all legal disclaimers that apply to the journal pertain.
References
- Ali AM, Saleh M, Eastell R, Wigderowitz CA, Rigby AS, Yang L. Influence of bone quality on the strength of internal and external fixation of tibial plateau fractures. J Orthop Res. 2006;24(11):2080–2086. doi: 10.1002/jor.20270. [DOI] [PubMed] [Google Scholar]
- Barber FA. Biodegradable Shoulder Anchors Have Unique Modes of Failure. Arthroscopy: The Journal of Arthroscopic & Related Surgery. 2007;23(3):316–320. doi: 10.1016/j.arthro.2007.01.014. [DOI] [PubMed] [Google Scholar]
- Barber FA, Feder SM, Burkhart SS, Ahrens J. The relationship of suture anchor failure and bone density to proximal humerus location: A cadaveric study. Arthroscopy: The Journal of Arthroscopic & Related Surgery. 1997a;13(3):340–345. doi: 10.1016/s0749-8063(97)90031-1. [DOI] [PubMed] [Google Scholar]
- Barber FA, Herbert MA. Suture anchors--update 1999. Arthroscopy. 1999;15(7):719–725. doi: 10.1016/s0749-8063(99)70003-4. [DOI] [PubMed] [Google Scholar]
- Barber FA, Herbert MA, Beavis RC, Barrera Oro F. Suture anchor materials, eyelets, and designs: update 2008. Arthroscopy. 2008;24(8):859–867. doi: 10.1016/j.arthro.2008.03.006. [DOI] [PubMed] [Google Scholar]
- Barber FA, Herbert MA, Click JN. Internal fixation strength of suture anchors--update 1997. Arthroscopy. 1997b;13(3):355–362. doi: 10.1016/s0749-8063(97)90034-7. [DOI] [PubMed] [Google Scholar]
- Barber FA, Herbert MA, Coons DA, Boothby MH. Sutures and suture anchors--update 2006. Arthroscopy. 2006;22(10):1063, e1061–1069. doi: 10.1016/j.arthro.2006.04.106. [DOI] [PubMed] [Google Scholar]
- Cadet ER, Hsu JW, Levine WN, Bigliani LU, Ahmad CS. The relationship between greater tuberosity osteopenia and the chronicity of rotator cuff tears. Journal of Shoulder and Elbow Surgery. 2008;17(1):73–77. doi: 10.1016/j.jse.2007.04.017. [DOI] [PubMed] [Google Scholar]
- Capiola D, Re L. Repair of patellar tendon rupture with suture anchors. Arthroscopy. 2007;23(8):906, e901–904. doi: 10.1016/j.arthro.2006.10.023. [DOI] [PubMed] [Google Scholar]
- Chapman JR, Harrington RM, Lee KM, Anderson PA, Tencer AF, Kowalski D. Factors affecting the pullout strength of cancellous bone screws. J Biomech Eng. 1996;118(3):391–398. doi: 10.1115/1.2796022. [DOI] [PubMed] [Google Scholar]
- Cummins CA, Murrell GAC. Mode of failure for rotator cuff repair with suture anchors identified at revision surgery. Journal of Shoulder and Elbow Surgery. 2003;12(2):128–133. doi: 10.1067/mse.2003.21. [DOI] [PubMed] [Google Scholar]
- Djurasovic M, Marra G, Arroyo JS, Pollock RG, Flatow EL, Bigliani LU. Revision Rotator Cuff Repair: Factors Influencing Results. J Bone Joint Surg Am. 2001;83(12):1849–1855. doi: 10.2106/00004623-200112000-00013. [DOI] [PubMed] [Google Scholar]
- Galatz LM, Rothermich SY, Zaegel M, Silva MJ, Havlioglu N, Thomopoulos S. Delayed repair of tendon to bone injuries leads to decreased biomechanical properties and bone loss. Journal of Orthopaedic Research. 2005;23(6):1441–1447. doi: 10.1016/j.orthres.2005.05.005.1100230629. [DOI] [PubMed] [Google Scholar]
- Goulet RW, Goldstein SA, Ciarelli MJ, Kuhn JL, Brown MB, Feldkamp LA. The relationship between the structural and orthogonal compressive properties of trabecular bone. J Biomech. 1994;27(4):375–389. doi: 10.1016/0021-9290(94)90014-0. [DOI] [PubMed] [Google Scholar]
- Hildebrand T, Laib A, Muller R, Dequeker J, Ruegsegger P. Direct three-dimensional morphometric analysis of human cancellous bone: microstructural data from spine, femur, iliac crest, and calcaneus. J Bone Miner Res. 1999;14(7):1167–1174. doi: 10.1359/jbmr.1999.14.7.1167. [DOI] [PubMed] [Google Scholar]
- Jacob AT, Ingalhalikar AV, Morgan JH, Channon S, Lim TH, Torner JC, Hitchon PW. Biomechanical comparison of single- and dual-lead pedicle screws in cadaveric spine. J Neurosurg Spine. 2008;8(1):52–57. doi: 10.3171/SPI-08/01/052. [DOI] [PubMed] [Google Scholar]
- Kaar TK, Schenck RC, Wirth MA, Rockwood CA. Complications of metallic suture anchors in shoulder surgery. Arthroscopy: The Journal of Arthroscopic & Related Surgery. 2001;17(1):31–37. doi: 10.1053/jars.2001.18246. [DOI] [PubMed] [Google Scholar]
- Kettler M, Lunger J, Kuhn V, Mutschler W, Tingart MJ. Failure strengths in distal biceps tendon repair. Am J Sports Med. 2007;35(9):1544–1548. doi: 10.1177/0363546507300690. [DOI] [PubMed] [Google Scholar]
- Matsuzaki H, Zaegel MA, Gelberman RH, Silva MJ. Effect of Suture Material and Bone Quality on the Mechanical Properties of Zone I Flexor Tendon-Bone Reattachment With Bone Anchors. The Journal of Hand Surgery. 2008;33(5):709–717. doi: 10.1016/j.jhsa.2008.01.025. [DOI] [PMC free article] [PubMed] [Google Scholar]
- McFarland EG, Park HB, Keyurapan E, Gill HS, Selhi HS. Suture anchors and tacks for shoulder surgery, part 1: biology and biomechanics. Am J Sports Med. 2005;33(12):1918–1923. doi: 10.1177/0363546505282621. [DOI] [PubMed] [Google Scholar]
- Meyer DC, Mayer J, Weber U, Mueller A, Koch PP, Gerber C. Ultrasonically implanted PLA suture anchors are stable in osteopenic bone. Clin Orthop Rel Res. 2006;442:143–148. doi: 10.1097/01.blo.0000185033.32220.57. [DOI] [PubMed] [Google Scholar]
- Millennium_Research_Group. US Markets for Orthopedic Soft Tissue Solutions 2008 2007 [Google Scholar]
- Odgaard A, Gundersen HJ. Quantification of connectivity in cancellous bone, with special emphasis on 3-D reconstructions. Bone. 1993;14(2):173–182. doi: 10.1016/8756-3282(93)90245-6. [DOI] [PubMed] [Google Scholar]
- Rebuzzi E, Coletti N, Schiavetti S, Giusto F. Arthroscopic rotator cuff repair in patients older than 60 years. Arthroscopy: The Journal of Arthroscopic & Related Surgery. 2005;21(1):48–54. doi: 10.1016/j.arthro.2004.09.019. [DOI] [PubMed] [Google Scholar]
- Sher JS, Uribe JW, Posada A, Murphy BJ, Zlatkin MB. Abnormal findings on magnetic resonance images of asymptomatic shoulders. J Bone Joint Surg Am. 1995;77(1):10–15. doi: 10.2106/00004623-199501000-00002. [DOI] [PubMed] [Google Scholar]
- Tingart MJ, Apreleva M, Lehtinen J, Zurakowski D, Warner JJ. Anchor design and bone mineral density affect the pull-out strength of suture anchors in rotator cuff repair: which anchors are best to use in patients with low bone quality? Am J Sports Med. 2004;32(6):1466–1473. doi: 10.1177/0363546503262644. [DOI] [PubMed] [Google Scholar]
- Tingart MJ, Lehtinen J, Zurakowski D, Warner JJ, Apreleva M. Proximal humeral fractures: regional differences in bone mineral density of the humeral head affect the fixation strength of cancellous screws. J Shoulder Elbow Surg. 2006;15(5):620–624. doi: 10.1016/j.jse.2005.09.007. [DOI] [PubMed] [Google Scholar]
- Vitale MA, Vitale MG, Zivin JG, Braman JP, Bigliani LU, Flatow EL. Rotator cuff repair: an analysis of utility scores and cost-effectiveness. J Shoulder Elbow Surg. 2007;16(2):181–187. doi: 10.1016/j.jse.2006.06.013. [DOI] [PubMed] [Google Scholar]
- Yakacki CM, Griffis J, Poukalova M, Gall K. Journal of Orthopaedic Research. 2009. Bearing area: A new indication for suture anchor pullout strength? (In Press), n/a. [DOI] [PubMed] [Google Scholar]


