
Figure 5. Funnel Plot of Studies Reporting Adjusted Odds Ratios.
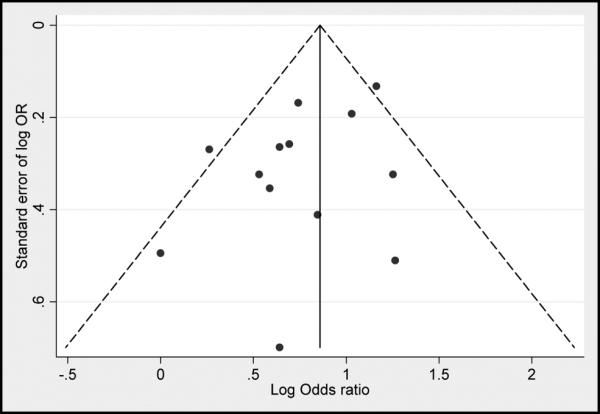
Plots are log standard error of effect estimate by adjusted effect estimate, centered on the pooled adjusted effect estimate. The pseudo 95% confidence interval corresponds to the expected 95% confidence interval for a given standard error. OR indicates odds ratio.