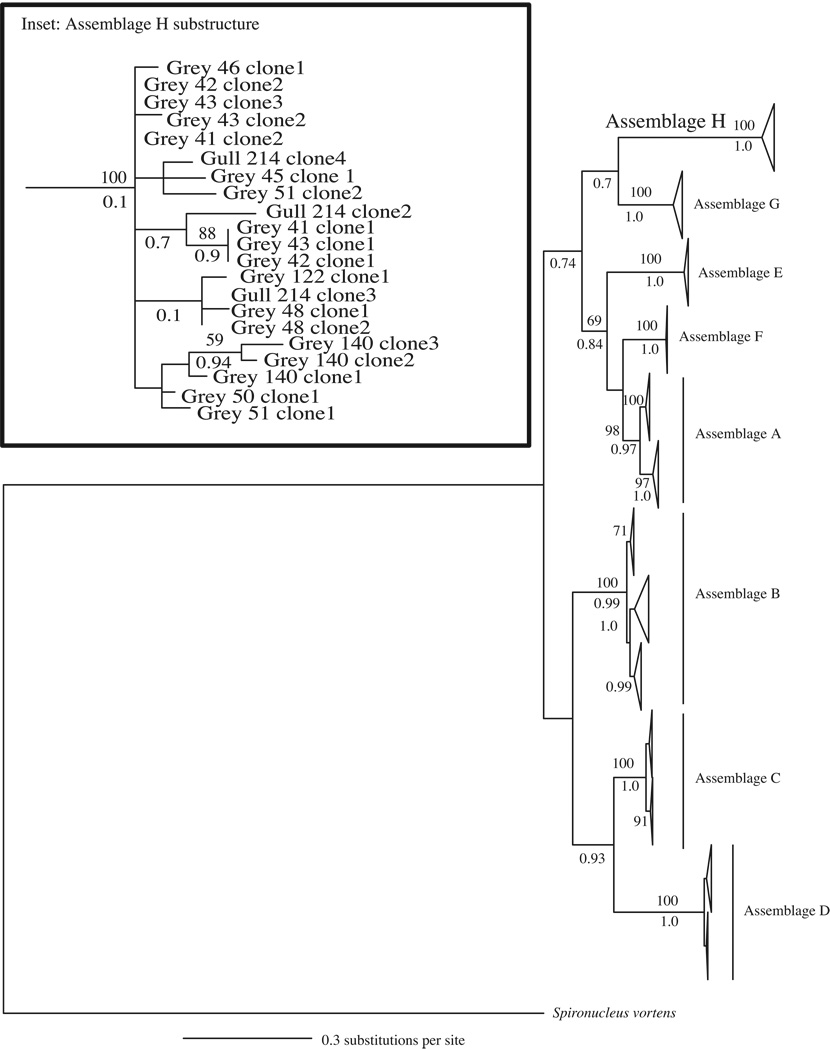
Fig. 2.
Glutamate dehydrogenase (gdh) gene tree depicting the relationships among all known Giardia duodenalis assemblages (A–G) and the newly characterized Assemblage H generated using Bayesian analysis. Sequences were 715 bp in length and chosen to maximize phylogenetic resolution while still representing the majority of the Assemblage H variants described. The gene tree is a consensus of 75,000 trees and rooted with Giardia ardeae and Spironucleus vortens. Posterior probabilities > 0.70 are shown below each branch. Bootstrap support > 50 from maximum likelihood (ML) analysis are shown above branches. The area of the triangle corresponds to the amount of variation within a clade. Inset highlights the variation and sub-structuring within Assemblage H and includes all variants (292–715 bp). Grey refers to grey seal.

