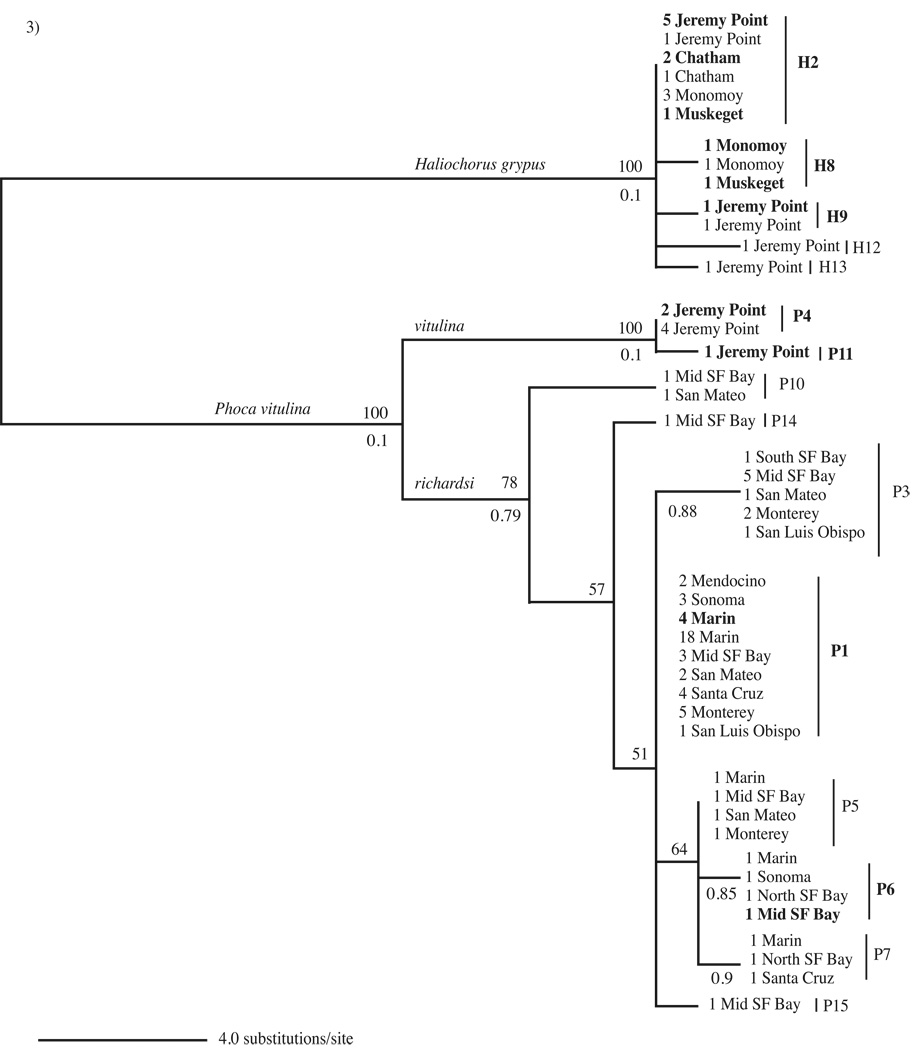
Fig. 3.
Seal mtDNA maximum likelihood tree. H2, H8, H9, H12 and H13 refer to grey seal (Halichoerus grypus) mtDNA haplotypes. P1, P3-P7, P10, P11, P14 and P15 refer to Atlantic and Pacific harbor seal (Phoca vitulina vitulina and Phoca vitulina richardsi) mtDNA haplotypes. All grey seal and Atlantic harbor seal samples derive from Massachusetts (east coast USA). All Pacific harbor seal samples derive from California (west coast, USA). Mid, North and South SF Bay refer to Mid, North, and South San Francisco Bay, which comprise the San Francisco Bay Area. The tree shows the number of times each haplotype was detected at a sampling site. Boldface indicates Giardia duodenalis positive seal samples. Bootstrap values > 50 are shown above branches and posterior probabilities > 0.70 from Bayesian analysis are shown below branches.

