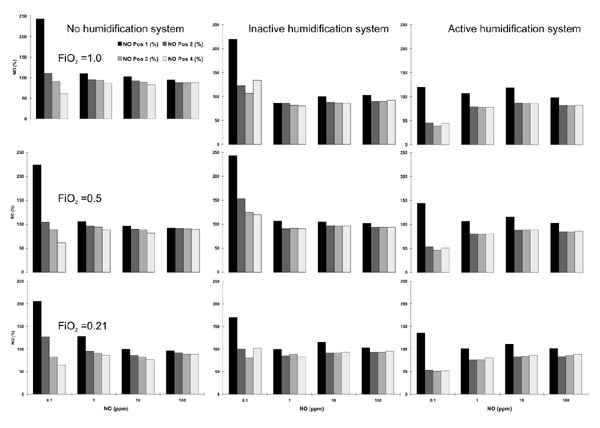
Figure 2.

Individual NO measurements for the different NO concentrations set (x-axis, NO) and the different FiO2 values as well as the different circuit setups. The NO concentrations are expressed as a percentage of the set NO concentration (y-axis). Each line of figures represents the different settings for FiO2. Each column of figures represents the different setups for the heating system.
