
Figure 3.
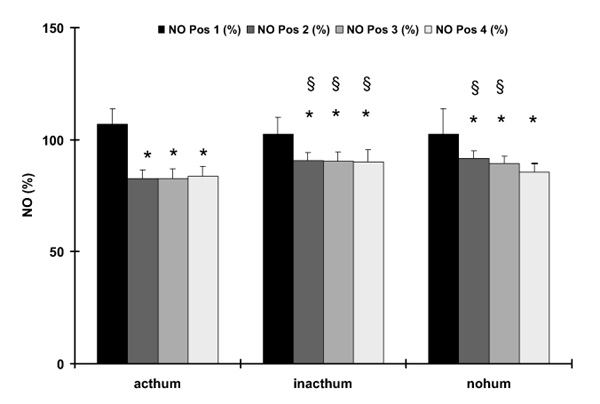
Nitric oxide (NO) concentrations as a percentage of the adjusted NO dose (y-axis) for the different setups of the heating system (x-axis). The different bars reflect the different measurement positions (see Fig 1). Data are given as mean± standard deviation. *P < 0.05, compared to pos.1 for a given setup; §P < 0.05, compared to the active humidification system (acthum) for a given position, inacthum, Inactive humidification system; nohum, no humidification system.