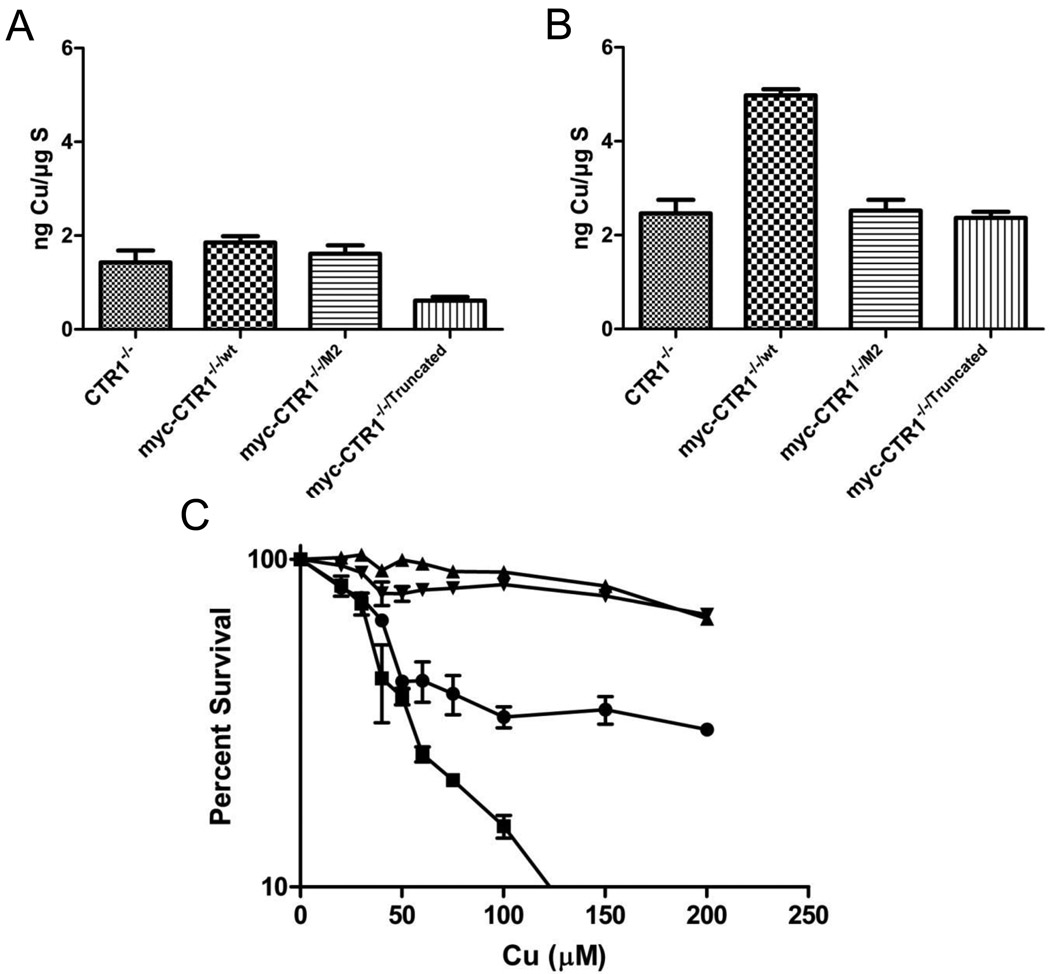
Figure 3.
Cu accumulation and cytotoxicity. A, total basal Cu; B, total Cu following 1 h exposure to 100 µM Cu; C, inhibition of growth of MEF cells during 96 h continuous exposure to varying concentrations of Cu. (●), CTR1−/−; (□), myc-CTR1−/−/wt; (▲), myc-CTR1−/−/M2; (▼), myc-CTR1−/−/Truncated. Each value represents the mean of no less than 3 independent experiments each performed with 3 separate cultures. Vertical bars, ± SEM.

