
Figure 1.
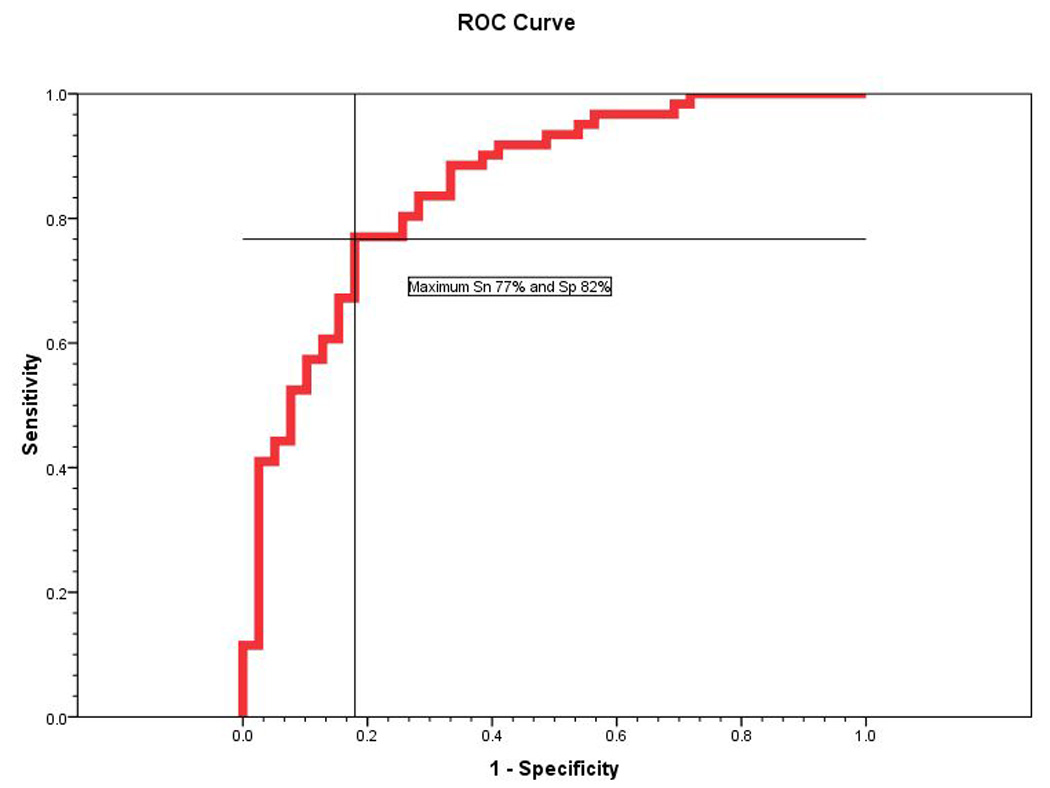
ROC curve for prediction of high KAM (>21.74 Nm of KAM). Cross bar indicates maximum sensitivity and specificity of the prediction model.
Official websites use .gov
A
.gov website belongs to an official
government organization in the United States.
Secure .gov websites use HTTPS
A lock (
) or https:// means you've safely
connected to the .gov website. Share sensitive
information only on official, secure websites.
ROC curve for prediction of high KAM (>21.74 Nm of KAM). Cross bar indicates maximum sensitivity and specificity of the prediction model.