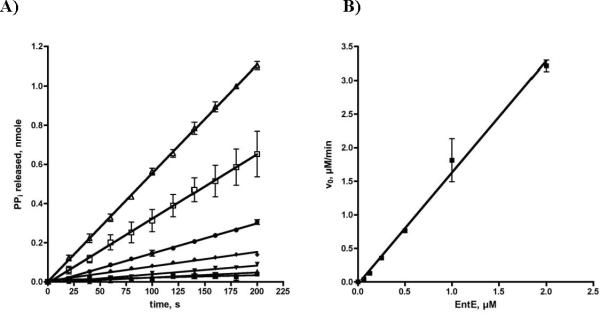
Fig 4.
A) Enzyme dependant time course of pyrophosphate release. Each reaction contained 50 mM Tris pH 8.0, 2.5 mM ATP, 100 μM 2,3 DHBA, 5 mM MgCl2, 0.5 mM DTT, 150 mM hydroxylamine pH 7, 0.1 U nucleoside phosphorylase, 0.04 U pyrophosphatase, and 0.2 mM MesG. EntE was used at 0 (∎), 62.5 nM (▲), 125 nM (▼), 250 nM (◆), 500 nM (●), 1000 nM (□), 2000 nM (△). B) Secondary plot of linear relationship between EntE concentration and initial velocity.

