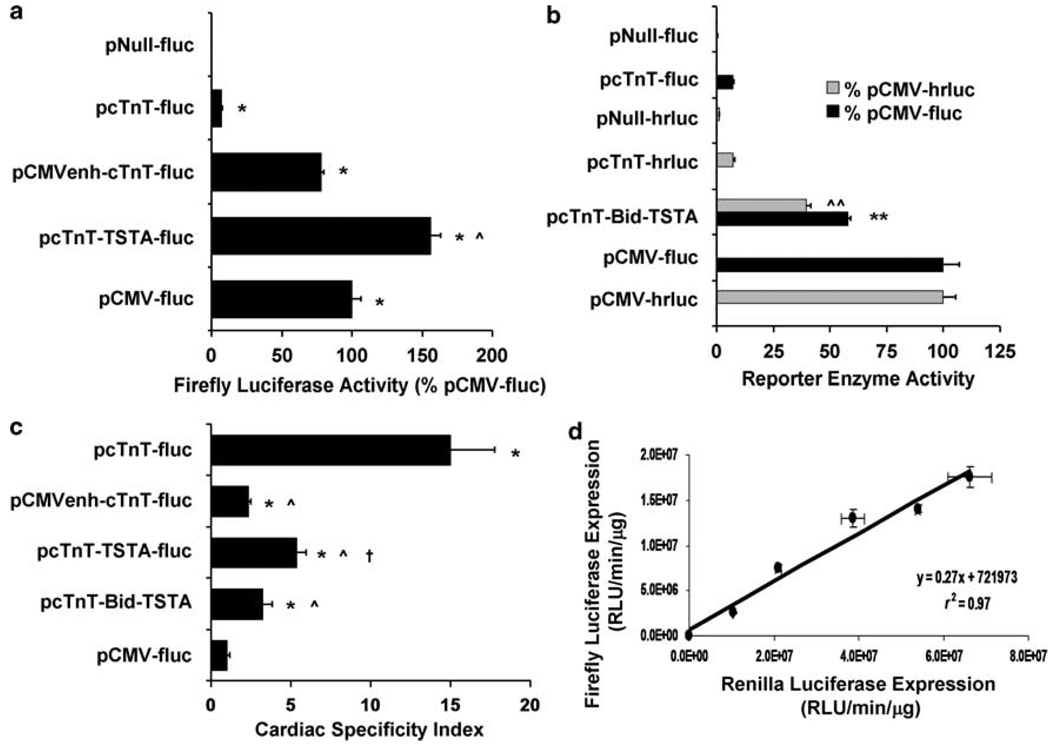
Figure 2.
In vitro characterizations of the TSTA-based strategies in terms of transcriptional amplification, cardiac specificity, and correlated reporter gene expression. Cardiac (HL-1) and non-cardiac cells were separately transfected with control (pNull-fluc, pNull-hrluc), one-step (pcTnT-fluc, pcTnT-hrluc), CMVenh-based (pCMVenh-cTnT-fluc), unidirectional TSTA (pcTnT-TSTA-fluc), bidirectional TSTA (pcTnT-Bid-TSTA), and reference (pCMV-fluc, pCMV-hrluc) vectors, with each vector co-delivered with a normalization vector (pCMV-β-gal). The cell lysates were assayed 24 h later for FLuc, RLuc, and β-GAL activities. The FLuc and RLuc activities were normalized to total protein, corrected for transfection efficiency (β-GAL activity), and, respectively, expressed as a percentage of FLuc activity of pCMV-fluc and RLuc activity of pCMV-hrluc. (a) The FLuc activity is shown for all fluc-containing vectors except for pcTnT-Bid-TSTA, whose FLuc (black solid bar) and RLuc (gray solid bar) activities are shown in (b) and compared against those of fluc- and hrluc-containing control, one-step, and reference vectors. *P< 0.005 compared with pNull-fluc; ^P< 0.001 compared with pCMVenh-cTnT-fluc; **P< 0.001 compared with pcTnT-fluc; ^^P< 0.002 compared with pcTnT-hrluc. (c) The cardiac-specificity index (CSI), derived from FLuc activity, is shown for each vector except for pNull-fluc, whose CSI could not be fairly assessed mathematically because of its near-zero expression in both cardiac and non-cardiac cell lines. *P< 0.04 compared with pCMV-fluc; ^P< 0.03 compared with pcTnT-fluc; †P< 0.01 compared with pCMVenh-cTnT-fluc. (d) HL-1 cells transfected with increasing doses of pcTnT-Bid-TSTA were assayed 24 h later for both FLuc and RLuc activities, which were normalized by total protein and plotted here against each other for each plasmid dose used. For all figures, the error bars represent s.e.m. for triplicate determinations.

