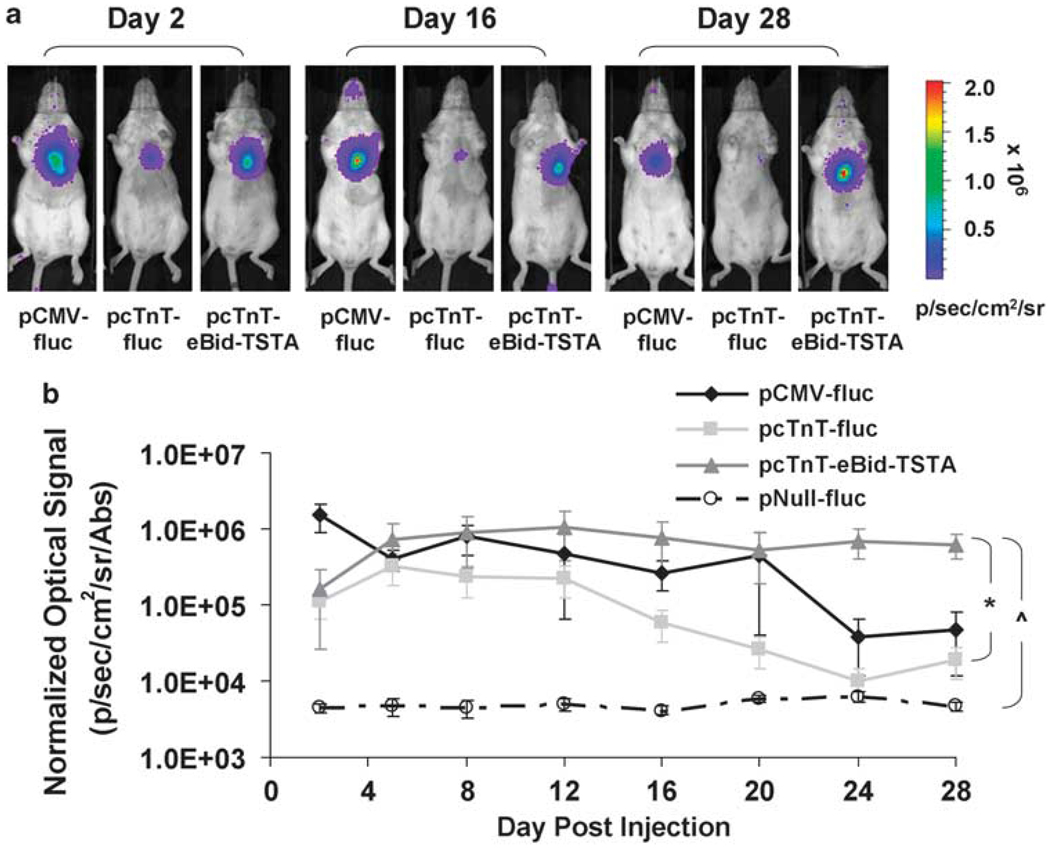
Figure 3.
Bioluminescence imaging of pcTnT-eBid-TSTA-mediated cardiac reporter gene expression in living mice. Serial BLI was performed on four mouse cohorts, which had separately undergone intramyocardial co-injections of (1) pCMV-fluc+pCMV-β-gal, (2) pcTnT-fluc+pCMV-β-gal, (3) pcTnT-eBid-TSTA+pCMV-β-gal, or (4) pNull-fluc+pCMV-β-gal. (a) The BLI images of three representative mice that received pCMV-fluc (left), pcTnT-fluc (middle), and pcTnT-eBid-TSTA (right), respectively, are shown for only days 2, 16, and 28. Each image is displayed on a rainbow scale in units of photons s−1 cm−2 sr−1) and overlaid onto a grayscale reference image of the corresponding mice. (b) The average heart signal on the post-operative days indicated was corrected for transfection efficiency [β-GAL activity in units of absorbance (Abs)] and plotted for each mouse cohort: pCMV-fluc (solid black diamond), pcTnT-fluc (light gray square), pcTnT-eBid-TSTA (dark gray triangle), and pNull-fluc (empty circle). Note that the signal is displayed on a log scale. The error bars represent s.e.m. for five mice. When considering the entire study period, *P< 0.012 between pcTnT-eBid-TSTA and pcTnT-fluc; ^P< 0.007 between pcTnT-eBid-TSTA and pNull-fluc.

