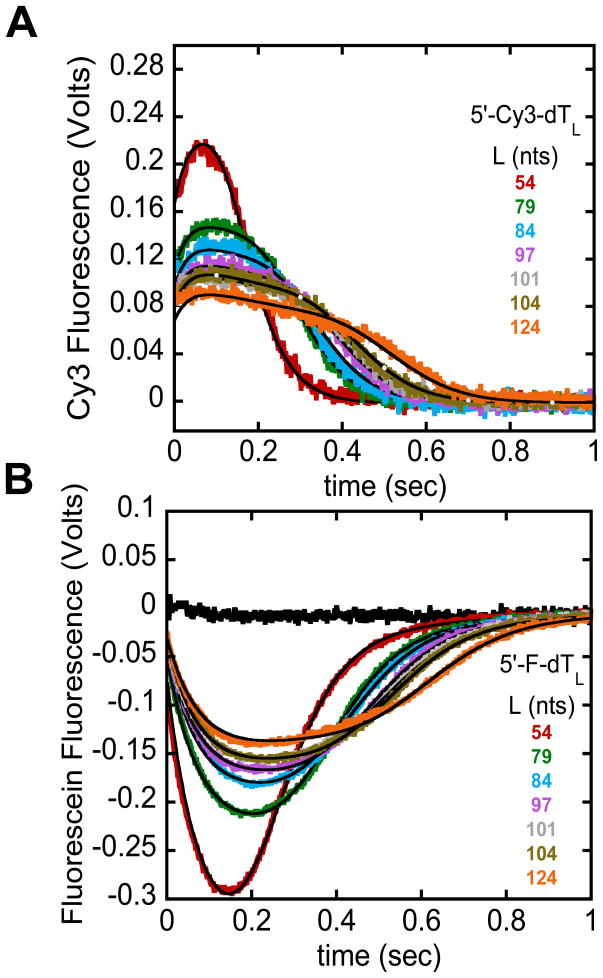
Figure 3.
Example analysis of the full translocation time courses using a n-step sequential model. E. coli UvrD monomer translocation along ssDNA monitored by the arrival of UvrD at the 5′-end of either Cy3 (A) or fluorescein (B) labeled (dT)L as described [9]. The black time course shows that the amount of heparin (trap) present in the reaction is sufficient to prevent UvrD from rebinding to ssDNA. The smooth black curves are simulations using the n-step sequential model and the best-fit parameters determined from a combined global NLLS analysis of the time courses in (A) and (B) [9].

