
Figure 5. ER Ca2+ ATP-dependent pump derives its ATP from both glycolysis and mitochondria.
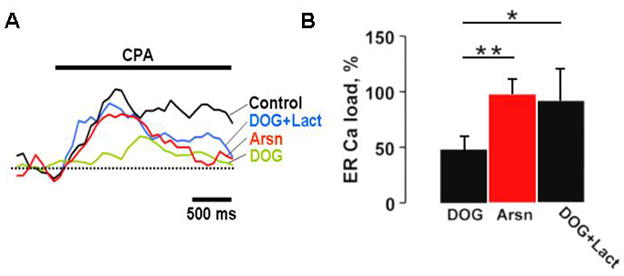
A) ER calcium load in cerebellar granule cells was assessed by measuring the area under the peak of [Ca2+]i induced by 50 μM CPA. Pretreatment with 10 mM DOG for 5 min led to a substantial reduction in ER calcium which was reversed by the addition of 5 mM lactate. Inhibition of mitochondrial citric acid cycle with 1 mM Arsn produced a negligible effect. B) Statistical analysis of the effects of metabolic inhibitors on ER calcium contents. Shown are the mean area values for each treatment expressed as a percentage of control (no drugs) and their corresponding confidence intervals derived from t-test with p<0.05, and n=6 (cells). ANOVA single factor analysis with Bonferroni correction was used to cross compare individual means for each inhibitor (* P<0.05, ** P<0.01).