
Figure 10.
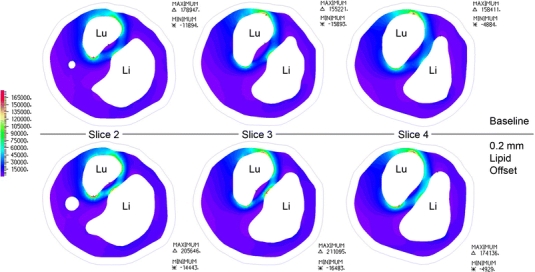
Axial “slices” through the region of interest, as shown in Fig. 9. First principal stresses are displayed for fibrous plaque layer in baseline model and model with 0.2 mm lipid surface offset. “Lu” shows the position of the lumen on each slice, “Li” shows the position of the lipid pool, and the outline of the outer vessel wall is shown for reference