
Figure 4.
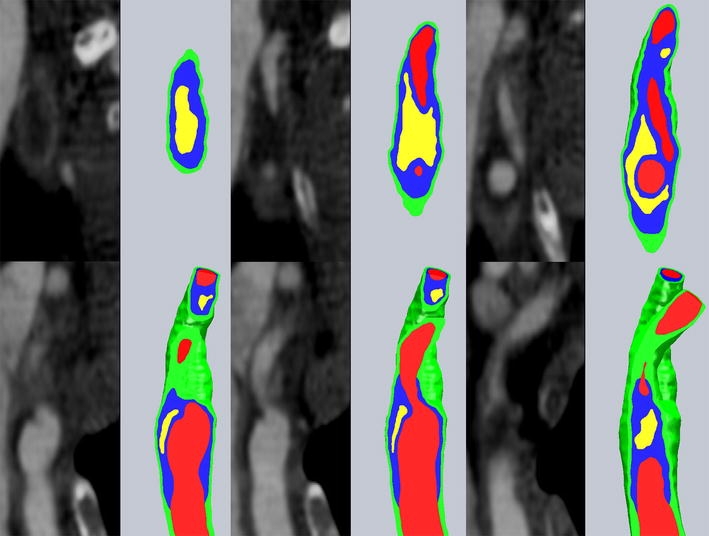
Coronal CTA image slices and corresponding slices through the reconstructed geometrical model. Green = healthy vessel wall; Red = vessel lumen; Yellow = lipid pool; Blue = fibrous plaque
Official websites use .gov
A
.gov website belongs to an official
government organization in the United States.
Secure .gov websites use HTTPS
A lock (
) or https:// means you've safely
connected to the .gov website. Share sensitive
information only on official, secure websites.
Coronal CTA image slices and corresponding slices through the reconstructed geometrical model. Green = healthy vessel wall; Red = vessel lumen; Yellow = lipid pool; Blue = fibrous plaque