
Figure 9.
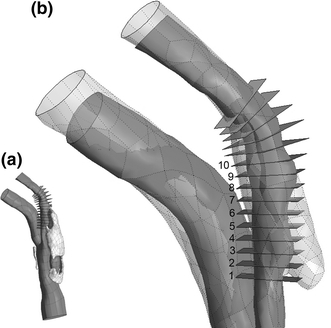
Cut planes on which first principal stress results are compared. (a) View of full lumen geometry and lipid pool with cut planes. (b) Zoom view of (a) in region of plaque rupture. Post-rupture lumen geometry shown in transparent gray. Stress results are presented for planes 1–10 only, as these cover the region of plaque rupture. The patient’s neck was positioned slightly differently for baseline and follow-up CTA studies, deforming the carotid geometry. Pre- and post-rupture lumen geometries were aligned for maximum overlap of ICA proximal and distal to the region of rupture