
FIGURE 3.
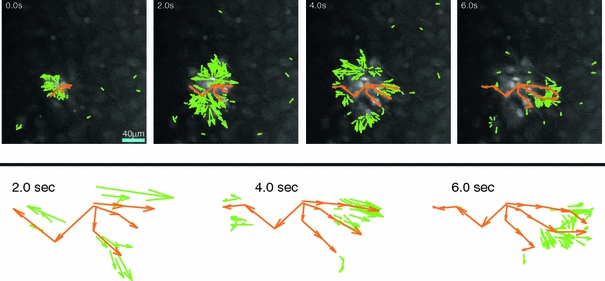
Comparison between computed optical flow vectors (green) and manually estimated flow vectors (orange) for a primary dissociated spontaneously forming astrocyte network in culture. While computed vectors were calculated for every pixel and every frame, manual vectors were estimated every four frames and only trace a few selected signals. Only reliable optical flow vectors are shown, and only one in four vectors in both horizontal and vertical directions are shown for clarity. Unlike the manual vectors, flow vectors are only shown for the current frame. The top sequence of panels show vectors overlaid on extracted frames from the actual movie at the indicated times for the entire field of view. The bottom panels show the vectors in detail for the 2, 4, and 6 s frames in order to more clearly assess the qualitative overlap between optical flow computed and manually estimated results. For optical flow vectors (in green), only vectors that putatively correspond to manual vectors (in orange) are shown, in contrast to the upper panels which show all computed vectors (see text). See Appendix for details regarding experimental preparations, imaging, and parameters for calculation