
FIGURE 5.
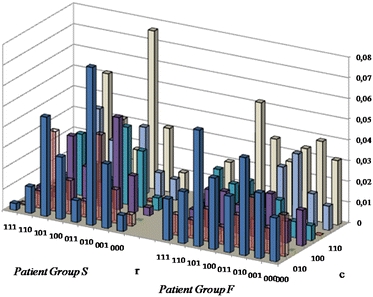
Examples of word distribution density in a patient of group S and a patient of group F. c = behavior of three successive RR(n) changes and r = behavior of three successive T Tot(n) changes
Official websites use .gov
A
.gov website belongs to an official
government organization in the United States.
Secure .gov websites use HTTPS
A lock (
) or https:// means you've safely
connected to the .gov website. Share sensitive
information only on official, secure websites.
Examples of word distribution density in a patient of group S and a patient of group F. c = behavior of three successive RR(n) changes and r = behavior of three successive T Tot(n) changes