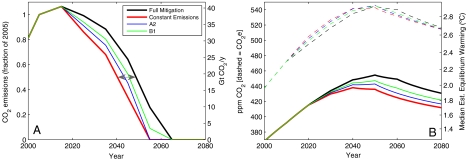
Fig. 2.
Target CO2 emissions and concentrations under four CC carbonaceous aerosol emission scenarios using our “best estimate” of RF from carbonaceous aerosols of 0.22 W m-2, as calculated using our simple atmospheric and economic model. (A) shows CO2 emissions relative to 2005 levels (on the left axis) and as an annual emission rate (on the right axis). The solid lines in (B) show the associated CO2 concentrations. The dashed lines in (B) indicate (on the left axis) total RF from all GHGs and carbonaceous aerosols in terms of ppm CO2e and (on the right axis) the associated equilibrium warming assuming a 3 °C/CO2 doubling climate sensitivity (24). The arrow (in A) indicates the 8 years difference in timing of the 50% reduction in CO2 emissions between the full mitigation and constant emissions scenarios. The scenarios are: Full mitigation—complete elimination of emissions of carbonaceous aerosols from CC by 2100; and constant emissions—1996 carbonaceous aerosol emissions continue through 2100. “A2” and “B1” are high and low projections of carbonaceous aerosol emissions from ref. 23 based on IPCC SRES storylines.

