Fig. 3.
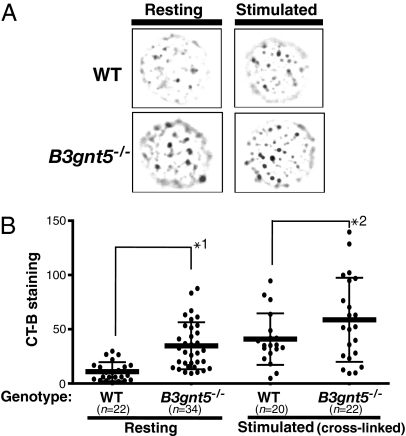
Fluorescence microscopy of GEMs on the cell surface. (A) Fluorescence microscopy showed a CT-B–induced punctate pattern indicating GEM structures on the B cell surface. Resting or stimulated isolated B cells were stained with FITC-conjugated CT-B. The results shown are representative of several independent experiments revealing markedly stronger staining of B3gnt5−/− than WT B cells. (B) Fluorescence intensity of positive signals for each CT-B–stained punctate region was analyzed by means of a BZ-Analyzer (KEYENCE). The total value of the positive signals on each cell surface was measured. Statistical analysis of the difference between WT and B3gnt5−/− B cells, with or without stimulation, was performed using one-way ANOVA and Tukey testing by means of PRISM4 software. Data are given as each cell type's mean (bold line) and SD. *1, P < 0.01; *2, P < 0.01.

