Fig. 3.
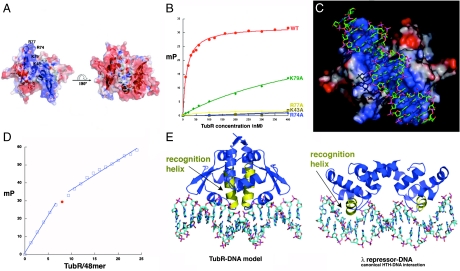
TubR-DNA binding. (A) Electrostatic surface potential of the TubR dimer. Blue and red represent electropositive and electronegative regions, respectively. (Left) The electronegative side of the TubR dimer, and the side on the right is the electropositive side. Labeled on the left side are the locations of the mutated residues. (B) FP binding isotherms showing the DNA binding of WT TubR and the K43A, R74A, R77A, and K79A mutants. Fluorescence polarization units (millipolarization) and TubR concentration (nM) are along the y and x axes, respectively. (C) TubR-DNA model showing TubR electrostatic potential. (D) Stoichiometry of TubR (subunit) binding showing titration curve of TubR into the 48-mer iteron resulting in a molar ratio of TubR subunit to DNA of eight (or four) dimers. (E) Left: Ribbon diagram of the TubR-DNA model with the recognition helices colored yellow. Right: Ribbon diagram showing a canonical HTH–DNA interaction (the λ repressor-DNA complex) with the recognition helices colored yellow (32).

