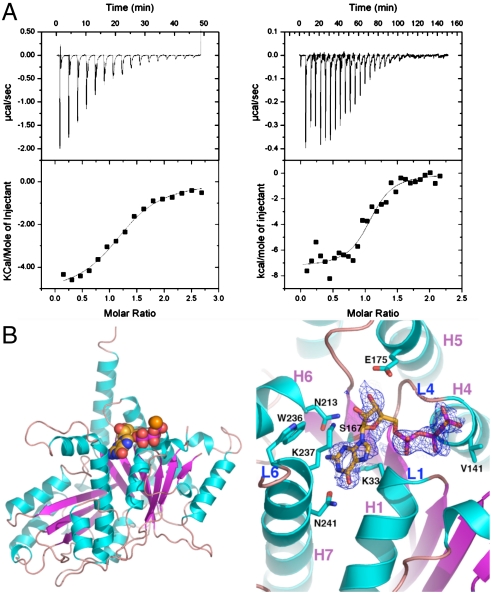
Fig. 5.
TubZ-guanine nucleotide interactions. (A) ITC binding isotherms showing TubZ-GDP (Left) and TubZ-GTP-γ-S interaction (Right). (B) Left: Overall structure of the TubZ-GTP-γ-S complex. β-strands are colored magenta and helices cyan, and the GTP-γ-S molecule is shown as cpk. Right: Close-up view of the GTP binding pocket with the initial Fo-Fc electron density map (Blue Mesh), contoured at 4.5σ, and calculated before the GTP-γ-S was included in refinement.

