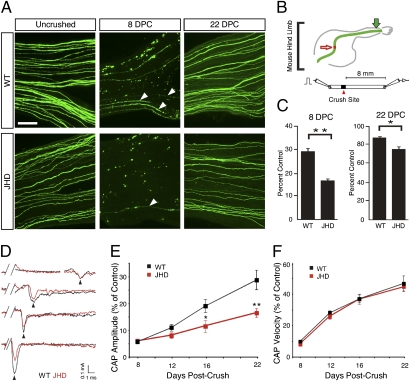
Fig. 4.
B-cell–deficient mice exhibit impaired axon regeneration after sciatic nerve injury. (A) Whole mount sciatic nerves from YFP positive JHD−/− and JHD+/− littermate control mice from uncrushed, 8, and 22 d postcrush (DPC). Arrowheads indicate regenerating axons. (B) Schematic of YFP positive sciatic nerve in mouse hind limb and electrophysiological recording. Red arrow indicates crush site. Green arrow indicates imaging site. A bipolar stimulating electrode was placed on the proximal end of the nerve and the recording electrode was placed on the distal end. (C) Ratio of the number of regenerating YFP positive axons to the number of uncrushed YFP positive nerves at 8 and 22 DPC (presented as mean ± SEM, n = 8–11 animals per genotype per time point). (D) Example traces of CAP recordings from WT (black) and JHD (red) nerves 8, 12, and 22 DPC. Note that the peak amplitude occurs at approximately the same time, but the CAPs from JHD nerves have smaller areas under the curve at 16 and 22 DPC. (E) Average CAP areas under the curve recorded from sciatic nerves of WT and JHD mice 8, 12, 16, and 22 DPC. The values are normalized to CAP area of uncrushed nerves (0.68 ± 0.06 mÅ*ms, n = 46). The CAP areas are statistically different between WT and JHD at 16 and 22 DPC. (F) CAP velocities recorded from sciatic nerves of WT and JHD mice 8, 12, 16, and 22 DPC. The values are normalized to the CAP velocity of uncrushed nerves (11.6 ± 0.4 m/s, n = 46). All data are from male mice and are presented as mean ± SEM. n = 4–18 animals per genotype per time point (*P < 0.05; **P < 0.01). (Scale bar, 200 μm.)

