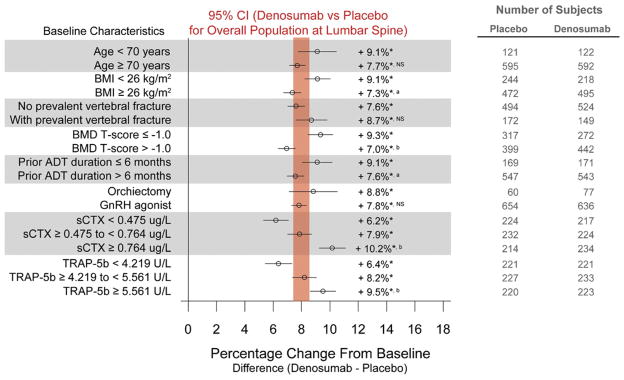
Figure 1.
Forest plots of treatment effect of denosumab at 36 months in percentage change from baseline (±95% CI) in BMD at the lumbar spine. Results are presented as least squares means. Vertical bar represents 95% CI for percentage difference in lumbar spine BMD between denosumab and placebo for overall population at 36 months. Asterisk indicates p < 0.0001 vs placebo. a indicates p < 0.05 between subgroups. b indicates p < 0.0001 between subgroups. NS, not significant between subgroups.

