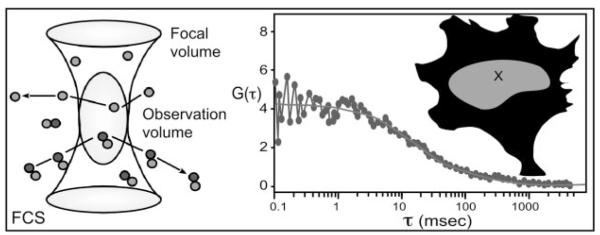
Fig. 3.
FCS Measures Fluorescence Signals within a Very Small Optically Defined Observation Volume
The amount of fluorescence detected from the observation volume over time will fluctuate with the concentration, retention, and rate of diffusion of the FP-labeled protein within the observation volume (X in the diagram). Correlation functions calculated from the fluctuation data are analyzed to determine the overall diffusion coefficients and concentrations of the proteins within the specified observation volume.

