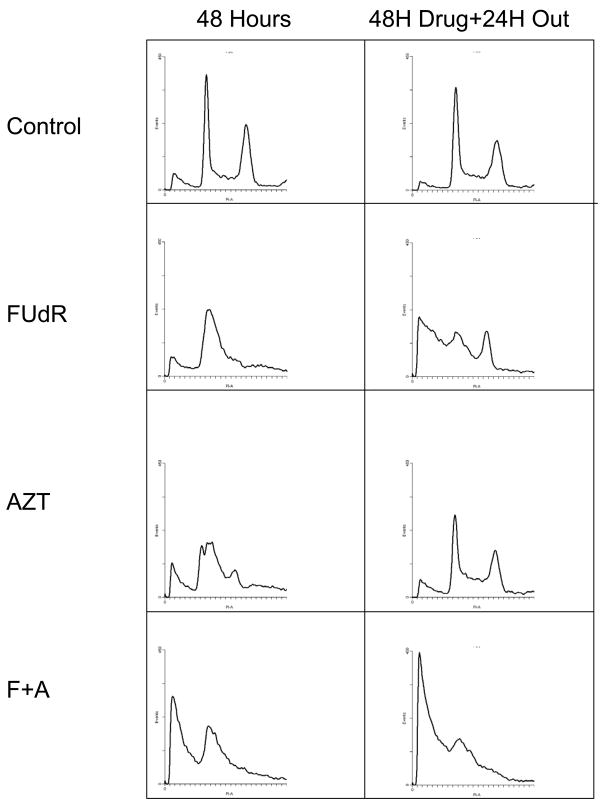
Figure 4.
Cell cycle changes resulting from drug treatment and recovery. HEC59 cells were exposed to 30 micromolar FUdR, 1 mM AZT or a combination. Samples of cells were collected after 48 hours of FUdR treatment alone, 24 hours of AZT treatment alone and concurrent treatment as shown in figure 1. Control cultures not treated with drug were also analyzed. Cells were collected, fixed and stained with propidium iodide as described in methods. HEC59+2 cultures were analyzed also with similar results. The scale for x- and y-axes are constant for all conditions shown. Parallel experiments in HEC59+2 gave similar results.

