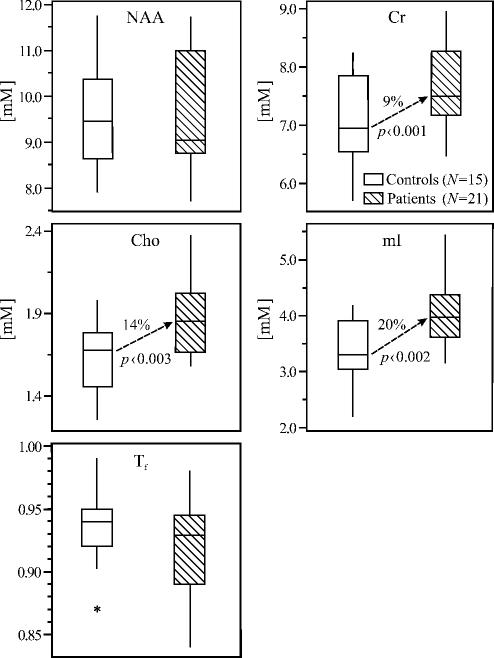
Fig. 4.
Box plots displaying the 25%, median and 75% (box), 95% (whiskers) and outliers (*) of the NAA, Cr, Cho and mI concentrations as well as tissue-fraction, Tf, distributions in the VOIs of patients and controls. Note the absence of atrophy and NAA loss versus significant 9, 14 and 20% elevation of Cr, Cho and mI in the recently diagnosed patients.

