Fig. 4.
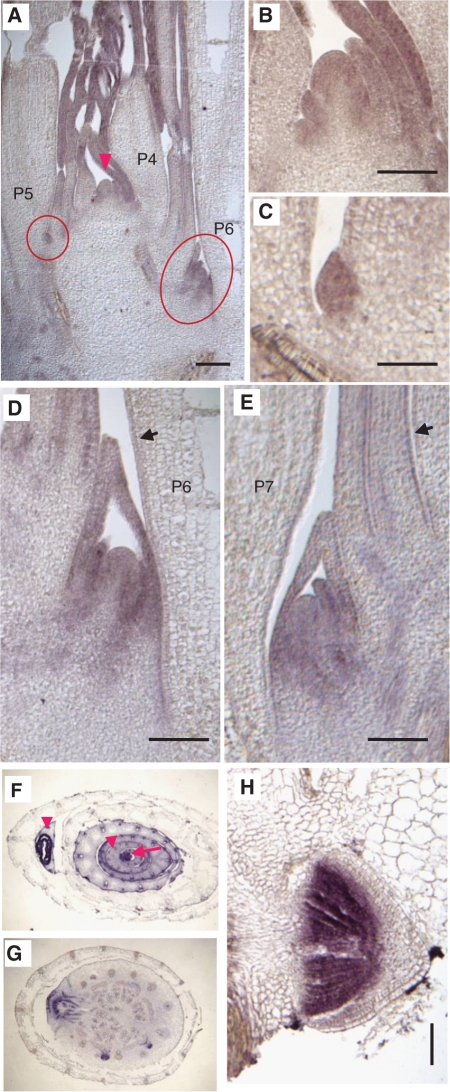
Spatial distribution of FC1 mRNA. (A) A longitudinal section of a young rice plant. Axillary buds are shown inside red circles. Arrowhead: shoot apical meristem (SAM). (B) A close-up of the SAM in A. (C) An axillary meristem in the axil of the P5 leaf. (D) An axillary bud in the axil of the P7 leaf. FC1 expression is observed in the axillary bud and the leaf epidermis (arrow). (E) An axillary bud in the axil of the P6 leaf. (F) A horizontal section of a seedling at the level of the top of the SAM. FC1 signal is observed in young leaves of the axillary bud and the main shoot (arrowhead), and in the SAM (arrow). (G) A horizontal section of a seedling at the level of the node. FC1 signal is observed in the tips of the crown roots and the vascular bundles. (H) A close-up of an initiating crown root. Bars: 200 μm in A; 100 μm in B, H; 50 μm in C–E.

