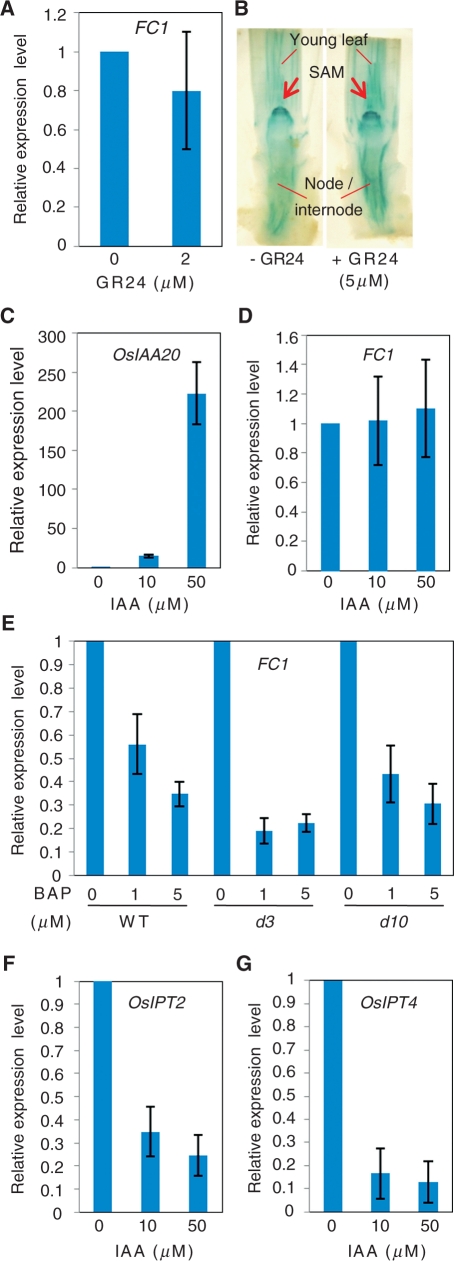
Fig. 5.
Hormonal control of FC1 expression. (A) Response of FC1 mRNA expression to treatment with 2 μM GR24. (B) Response of FC1promoter::GUS expression to treatment with 2 μM GR24. (C and D) Responses of OsIAA20 (C) and FC1 (D) mRNA expression to treatment with various concentrations of IAA. (E) Response of FC1 mRNA expression to treatment with various concentrations of benzyl aminopurine (BAP). (F and G) Responses of OsIPT2 (F) and OsIPT4 (G) mRNA expression to treatment with various concentrations of IAA. Expression levels are shown as values relative to that of mock treatment.

